


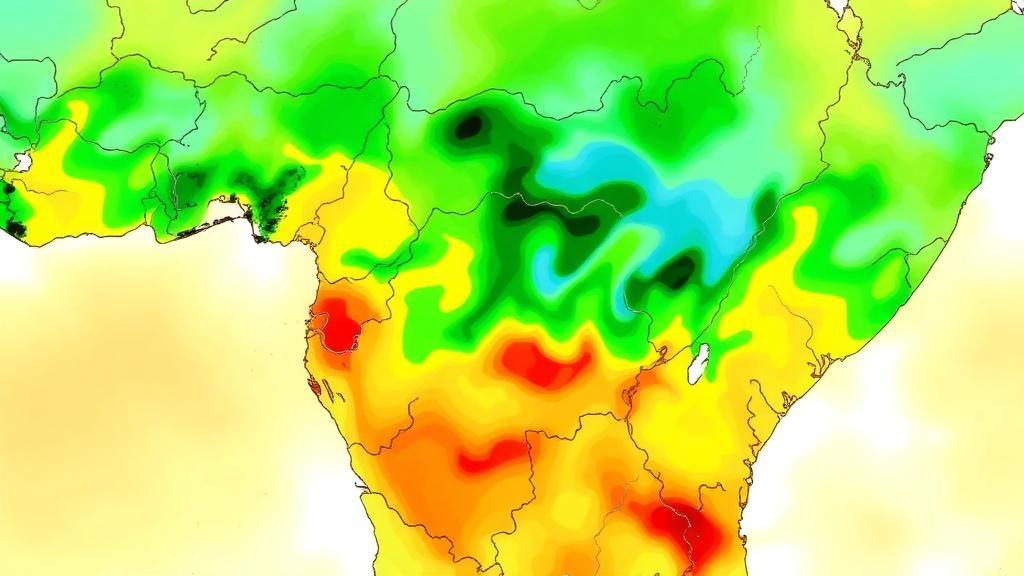
Nigeria is home to one of the steepest hydroclimatic gradients anywhere in Africa. In the humid equatorial south, mean annual rainfall can exceed 2,300 millimetres, while the drought-prone Sahelian zones of the far north average less than 500 millimetres per year. Between those two extremes lies a continuum of monsoon-driven regimes on which tens of millions of farmers, dam operators and city planners depend. A new study published in Theoretical and Applied Climatology shows that this already-fragmented rainfall landscape is not merely variable but actively changing, and it offers a machine-learning toolkit designed to track that change in a way engineers and water managers can actually interpret.
The research, led by Chinyere P. Okechukwu of Lovely Professional University together with colleagues at Nnamdi Azikiwe University and Ogbonnaya Onu Polytechnic, assembled 43 years of quality-controlled monthly rainfall records, spanning 1981 to 2023, from 38 stations across the country. Rather than treating Nigeria as a single statistical unit, the team first asked whether the data themselves reveal natural rainfall regions. Using ensemble clustering on a 15-dimensional feature space capturing seasonal, magnitude and variability characteristics, they identified four homogeneous rainfall zones, with a Silhouette coefficient of 0.375 and a Davies–Bouldin index of 0.696 quantifying the coherence of the resulting groups. The zones include a Coastal Humid region, a Transitional Sub-Humid belt, a Northern Arid/Sahelian zone and a smaller cluster of anomalous or outlier stations that behave unlike their neighbours.
With the regional map in hand, the authors turned to trend detection. Mann–Kendall tests, a standard non-parametric tool for identifying monotonic change in noisy hydrological series, revealed statistically significant wetting trends in two zones that might surprise observers accustomed to narratives of Sahelian desiccation. The Transitional Sub-Humid zone showed a trend statistic of Z = 3.516 with a p-value of 0.0004 and a slope of 0.607 millimetres per year, while the Northern Arid/Sahelian zone recorded Z = 5.065, p < 0.0001, and a slope of 0.529 millimetres per year. Crucially, the increases were concentrated in the June-to-September monsoon season, the window when most of the region’s crops depend on rain and when saturated soils are most vulnerable to flooding.
Trends in the mean, however, tell only part of the story. Extreme rainfall events, not averages, destroy infrastructure and displace communities. To characterise those extremes, the team fitted Generalized Extreme Value (GEV) models, the workhorse of hydrological risk analysis, and allowed the distribution’s parameters to vary through time rather than assuming a stationary climate. Model comparison using the Bayesian Information Criterion showed that non-stationary formulations were consistently preferred, with ΔBIC values ranging from 7.52 to 189.07 across zones, evidence that the statistical behaviour of rainfall extremes has genuinely shifted over the four-decade record. Interestingly, when it came to estimating return levels, a stationary LogNormal distribution provided the best overall fit, a reminder that model choice in extreme-value analysis remains a careful balancing act between flexibility and parsimony.
The return-level estimates carry direct engineering consequences. The 100-year rainfall, the depth expected to be exceeded on average once per century, ranged from 382.6 millimetres in the Northern Arid zone to 643.8 millimetres in the Coastal Humid zone. Because these figures are rising against a background of non-stationarity, drainage systems, culverts and flood defences designed decades ago using historical stationarity assumptions are increasingly likely to be undersized. The authors argue that their zone-specific return levels offer a more defensible basis for climate-resilient infrastructure design than national averages or legacy design manuals.
The predictive phase of the framework compared a battery of machine-learning models across the four zones, and the results underline a central lesson of modern applied machine learning: no single algorithm wins everywhere. Random Forest achieved the strongest performance in the Outlier, Transitional and Northern Arid zones, with Nash–Sutcliffe Efficiency (NSE) values ranging from 0.654 to 0.894, while Support Vector Regression took the lead in the Coastal Humid zone with an NSE of 0.735. To test whether the models had genuinely learned transferable rainfall physics rather than station-specific quirks, the team employed Leave-One-Cluster-Out cross-validation, training on three zones and predicting the held-out one, which yielded NSE values from 0.220 to 0.766, a more sobering but honest picture of spatial generalisation.
Deep learning added a further twist. Across repeated runs, standard Long Short-Term Memory (LSTM) networks consistently outperformed their Bidirectional counterparts in the Coastal Humid, Transitional and Northern Arid zones, posting mean NSE values of 0.625, 0.778 and 0.870 respectively, against 0.465, 0.368 and 0.353 for the Bidirectional LSTM. The two architectures performed comparably only in the Outlier/Anomalous zone. Because bidirectional models read the input sequence forwards and backwards, they are often assumed to extract richer temporal context; here, that extra capacity conferred no consistent advantage, suggesting that for monthly rainfall prediction the relevant information is largely causal, carried by antecedent conditions rather than future context.
What elevates the study beyond a leaderboard of algorithms is its commitment to explainability. Using SHapley Additive exPlanations (SHAP), a game-theoretic method that attributes each prediction to individual input features, the authors found that Lag-1 rainfall, the previous month’s total, was the dominant predictor in every zone, with mean absolute SHAP values between 51.0 and 92.8 millimetres. More strikingly, trend-related features carried meaningful attribution weight, revealing that the models had absorbed the long-term intensification signal embedded in the record, particularly in the Sahelian north. In other words, the networks were not merely memorising seasonality; they were detecting the slow drift of a changing climate.
Equally notable is what the models did not find. Indices of the El Niño–Southern Oscillation (ENSO), the Atlantic Multidecadal Oscillation (AMO) and the Intertropical Convergence Zone (ITCZ) proved non-significant across all cluster stations, indicating that, at the monthly scale and within these zones, local antecedent rainfall and embedded trends dominate predictability over large-scale teleconnections. For forecasters in West Africa, that is an actionable result: it suggests that skilful monthly outlooks can be built primarily from local observation networks, even where global climate-index-based forecasting underperforms.
The framework’s broader significance lies in its integration. Regionalisation, trend analysis, non-stationary extreme-value modelling, deep learning prediction and SHAP-based attribution are usually pursued as separate exercises; here they form a single pipeline that connects data-driven rainfall zoning to physically interpretable, zone-specific insight. The authors position the work as a foundation for climate-resilient infrastructure design, flood risk management and adaptive water resource planning in Nigeria and in other monsoon-driven regions facing similar gradients. As rainfall extremes continue to drift away from the stationary past, tools that are simultaneously accurate and transparent may prove as important as the rain gauges themselves.
Subject of Research: Explainable machine learning for non-stationary rainfall modelling and extreme value analysis in Nigeria
Article Title: A non-stationary and explainable machine learning framework for adaptive rainfall modelling
Article References: Okechukwu, C. P., Anabike, I. C., Ubaoji, K. I., Ugorji, C. C., Paul, R. U., & Obulezi, O. J. (2026). A non-stationary and explainable machine learning framework for adaptive rainfall modelling. Theoretical and Applied Climatology, 157(10), Article 617. https://doi.org/10.1007/s00704-026-06583-3
Image Credits: AI Generated
DOI: 10.1007/s00704-026-06583-3
Keywords: rainfall modelling, machine learning, Nigeria, extreme value analysis, GEV distribution, LSTM, SHAP explainability, Mann-Kendall trend test, monsoon, climate non-stationarity, flood risk, Sahel
Cite Scienmag News
Violet Maxwell. (October 8, 2026). Explainable AI Maps Shifting Rainfall Extremes Across Nigeria’s Climate Gradient. Scienmag. https://scienmag.com/explainable-ai-maps-shifting-rainfall-extremes-across-nigerias-climate-gradient/
Violet Maxwell. "Explainable AI Maps Shifting Rainfall Extremes Across Nigeria’s Climate Gradient." Scienmag, 8 October 2026, https://scienmag.com/explainable-ai-maps-shifting-rainfall-extremes-across-nigerias-climate-gradient/. Accessed 8 October 2026.
Violet Maxwell. "Explainable AI Maps Shifting Rainfall Extremes Across Nigeria’s Climate Gradient." Scienmag. October 8, 2026. https://scienmag.com/explainable-ai-maps-shifting-rainfall-extremes-across-nigerias-climate-gradient/


