


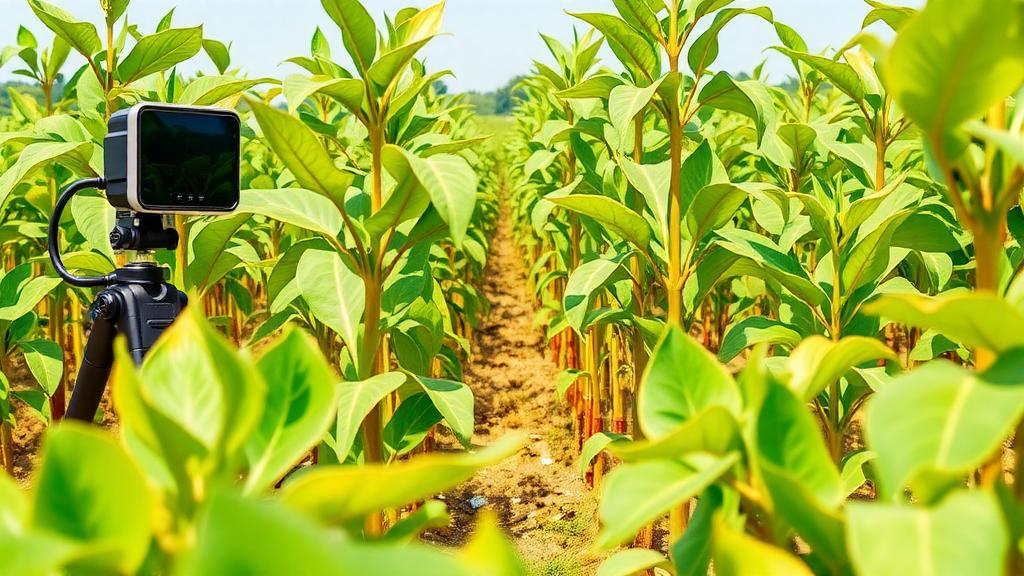
Soybean farming is locked in a quiet arms race with disease. Across the tropics, and above all in Brazil, two fungal pathogens—Asian soybean rust (Phakopsora pachyrhizi) and target spot (Corynespora cassiicola)—routinely strip yield from fields that look, to the untrained eye, perfectly green. A complex of roughly forty diseases attacks the crop worldwide, but these two have become the most damaging, with target spot in particular surging since 2010 as susceptible cultivars spread and fungicides lost potency through overuse. Traditional diagnosis depends on experienced pathologists inspecting leaves by hand, a process that is slow, expensive, hard to reproduce, and often ambiguous, because different diseases can produce strikingly similar symptoms. Now a team of Brazilian researchers has shown that a handheld hyperspectral sensor paired with machine learning can identify both diseases and grade their severity with accuracy approaching ninety-four percent, offering a glimpse of a future in which crop disease is diagnosed by light rather than by labor.
The study, published in Smart Agricultural Technology, was led by Dthenifer Cordeiro Santana and colleagues at the Federal University of Mato Grosso do Sul (UFMS). The team ran two field experiments during the 2022/2023 growing season in the state of Mato Grosso do Sul, one at Nova França Farm in Costa Rica to produce leaves infected with target spot, and another at Gávea Farm in Chapadão do Sul to obtain rust-infected material. Both sites sit in a humid tropical climate on clay-textured Oxisol soils, and both were sown on October 15, 2022 with the cultivar M 5947 IPRO at a density of fourteen plants per meter. Rather than relying on natural infection alone, the researchers engineered a gradient of disease pressure through carefully timed fungicide programs—seventeen treatments for target spot and staged regimes for rust—so that leaves could be harvested at zero, twenty-five, and fifty percent symptomatic area.
Leaf collection took place at the R5.5 phenological stage, during grain filling, with one hundred leaves sampled for each severity level of each disease. The samples were classified against a standard diagrammatic severity scale, stored in polystyrene boxes to preserve turgor, and rushed to the UFMS Spectroscopy Laboratory in Chapadão do Sul. This ex situ approach was deliberate: by measuring leaves in the laboratory, the team could standardize illumination, acquisition geometry, and the sampled area while stripping out the confounding noise of canopy structure, soil background, shading, and field heterogeneity. It is the spectral equivalent of listening to a single violin in a soundproof room rather than in the middle of an orchestra.
Each leaf was scanned with a FieldSpec 3 Jr spectroradiometer using an ASD Plant Probe with its own light source, capturing reflectance from 350 to 2500 nanometers—three readings per leaf, averaged. That full spectrum yields 1025 individual data points per sample, a richness that is both a blessing and a computational burden. To tame it, the researchers tested two dimensionality-reduction schemes drawn from earlier work: the spectrum partitioned into 28 broader spectral bands, and a set of 22 reflectance inflection differences, or RIDs, which capture where the spectral curve changes slope. Principal component analysis on these reduced datasets explained eighty-five percent of total variance and immediately revealed structure: target spot was associated with essentially every spectral band, while soybean rust at fifty percent severity clustered with bands B11 through B22, spanning 501 to 710 nanometers, and with band B27 at 1930 nanometers in the short-wave infrared. Healthy leaves, by contrast, linked most strongly to the first three bands in the deep violet edge of the visible range.
The spectral signatures themselves told a biologically coherent story. Target spot produced the highest reflectance of any class across the entire spectrum, a consequence of the way its necrotic lesions destroy leaf architecture. As lesions progress from healthy tissue through affected tissue to dead, concentric necrotic zones, they degrade chlorophyll, disrupt the spongy mesophyll, and collapse the internal scattering structures that normally dominate near-infrared reflectance. Tissue necrosis is known to raise infrared reflectance, and the loss of pigment pushes reflectance up in the visible bands as leaves yellow. Fungal spore pigmentation may add further signal in the 580 to 700 nanometer range. Rust behaves differently: its uredinia, the pathogen’s reproductive structures, form within the leaf and alter photosynthesis and pigment content in surrounding tissue, producing more pronounced differences in the visible and near-infrared regions but far weaker separation in the short-wave infrared, where rust curves overlapped with healthy leaves at several points—likely because the pathogen, once established inside the leaf, does not dramatically extract water from it, and the SWIR region is closely tied to leaf water content.
With signatures established, the team put ten machine learning algorithms to work on three different inputs: the full spectrum, the 28 spectral bands, and the 22 RIDs. The lineup included multilayer perceptron neural networks, REPTree and J48 decision trees, Random Forest, Random Tree, Logistic Regression, AdaBoost, Bagging, and Sequential Minimal Optimization (SMO), a support vector machine implementation. All models were run in WEKA with default hyperparameters and evaluated by stratified ten-fold cross-validation repeated ten times, scored on correctly classified instances, the Kappa statistic, and the F-measure. The results formed a clear pattern. For disease identification, Logistic Regression and SMO fed the full spectrum were the champions, reaching roughly ninety-four percent correctly classified instances, a Kappa of about 0.9, and an F-measure near 0.9. When inputs were reduced, the multilayer perceptron and Logistic Regression took the lead, hitting around ninety percent accuracy with either spectral bands or RIDs.
Severity classification proved harder, as expected, but the models still performed impressively. Using the full spectrum, SMO alone stood out, achieving eighty-seven percent correctly classified instances and a Kappa of 0.85. With reduced inputs, the multilayer perceptron and Logistic Regression again excelled, reaching about eighty-three percent accuracy with RIDs and roughly eighty-two percent with spectral bands, with Kappa values around 0.78 to 0.79. The practical implication is significant: where computing power or sensor capability is limited, farmers and agronomists can trade a few points of accuracy for dramatically faster processing by using compressed spectral information, without abandoning the diagnostic pipeline altogether.
The authors were careful to address an obvious confound: could the fungicides themselves, rather than the diseases, have shaped the spectral signatures? They note that hyperspectral detection of fungicide deposits has been demonstrated in grapevine, so the possibility cannot be categorically dismissed. However, evidence from soybean suggests the effect is minor at recommended field rates. Previous studies found no significant impact of triazole-, strobilurin-, and carboxamide-containing fungicides on gas exchange, chlorophyll fluorescence, or yield in disease-free plants, and up to three consecutive applications across fifteen fungicide programs did not significantly alter soybean canopy reflectance in the visible and near-infrared. Crucially, leaves in this study were assigned to classes by their realized symptomatic area on a diagrammatic scale, not by treatment identity. Still, the team acknowledges that because fungicide regime and disease severity were not fully orthogonal—particularly in the rust experiment—the design cannot statistically separate fungicide effects from disease effects, and the models should be read as identifying spectral patterns associated with observed disease type and severity under the tested field conditions.
What elevates the work beyond a proof of concept is its integrated comparison of processing and classification strategies. Rather than simply confirming that hyperspectral data can distinguish sick plants—a result now well established for grapevine trunk diseases, tomato bacterial leaf spot, strawberry gray mold, and soybean frogeye leaf spot—the study maps how dimensionality reduction and input selection change the performance of each algorithm. That map matters for anyone building a real diagnostic tool, because it says which combinations to deploy under which constraints. The authors are candid about the next hurdles: the measurements were made on detached leaves in a laboratory, and real-world scouting will have to contend with canopy architecture, natural lighting, soil background, and shading. They call for future work using in situ field measurements, validation across independent locations and seasons, and a factorial pathogen-by-fungicide design that includes fungicide-treated pathogen-free plants and untreated infected plants to fully disentangle the signals.
Even with those caveats, the trajectory is unmistakable. A sensor that reads a leaf’s chemistry through its reflectance, coupled with algorithms that classify disease and severity in seconds, could transform phytosanitary management from reactive guesswork into precision intervention—spotting infections early, targeting fungicide applications only where needed, and slowing the resistance crisis that has made target spot such a formidable adversary. Detecting the lowest severity levels remains the field’s holy grail, and the authors flag it as a priority for future research. But the core demonstration stands: the spectral fingerprint of a diseased soybean leaf is rich enough, and machine learning is now sharp enough, that the eye of a trained pathologist may soon have a tireless, nanometer-precise rival.
Subject of Research: Hyperspectral sensing and machine learning for identifying soybean diseases and infection severity levels
Article Title: Beyond visual inspection: Smart identification of soybean diseases and infection severities using hyperspectral sensor
Article References: Santana, D. C., Baio, F. H. R., Otone, J. D. D. Q., Martins, E. V., Teodoro, L. P. R., Aptoula, E., & Teodoro, P. E. (2026). Beyond visual inspection: Smart identification of soybean diseases and infection severities using hyperspectral sensor. Smart Agricultural Technology, 15, Article 102502. https://doi.org/10.1016/j.atech.2026.102502
Image Credits: AI Generated
DOI: 10.1016/j.atech.2026.102502
Keywords: soybean, hyperspectral sensing, machine learning, soybean rust, target spot, plant disease detection, precision agriculture, remote sensing, spectral signatures, support vector machines, dimensionality reduction, Brazil
Cite Scienmag News
Alan Morgan. (October 2, 2026). Hyperspectral Sensor and AI Detect Soybean Diseases Before the Eye Can. Scienmag. https://scienmag.com/hyperspectral-sensor-and-ai-detect-soybean-diseases-before-the-eye-can/
Alan Morgan. "Hyperspectral Sensor and AI Detect Soybean Diseases Before the Eye Can." Scienmag, 2 October 2026, https://scienmag.com/hyperspectral-sensor-and-ai-detect-soybean-diseases-before-the-eye-can/. Accessed 2 October 2026.
Alan Morgan. "Hyperspectral Sensor and AI Detect Soybean Diseases Before the Eye Can." Scienmag. October 2, 2026. https://scienmag.com/hyperspectral-sensor-and-ai-detect-soybean-diseases-before-the-eye-can/


