


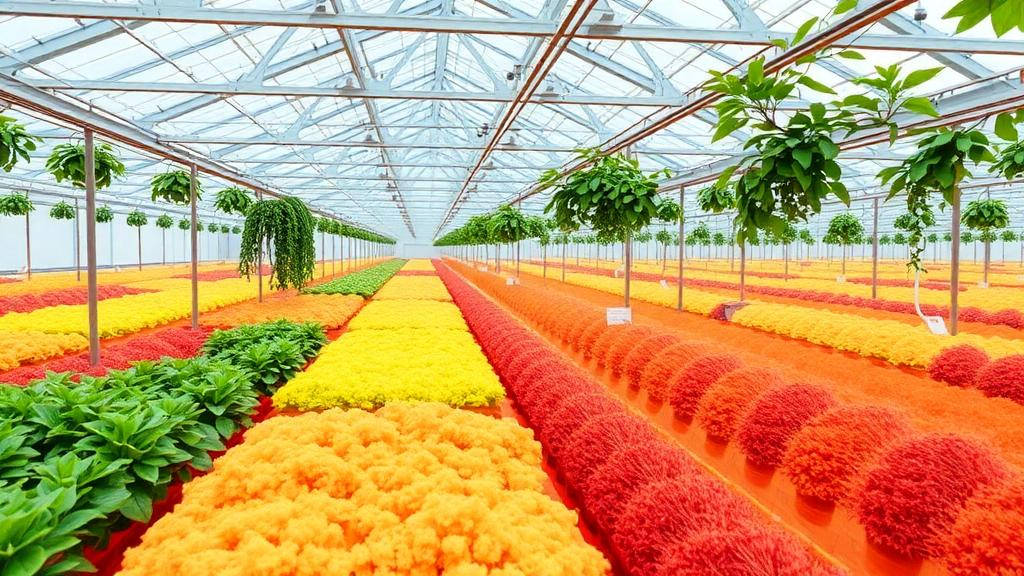
Inside a Chinese solar greenhouse, the air is not one climate but many. On a sunny winter afternoon, the temperature near the translucent south-facing roof can be several degrees warmer than the air at the base of the crop canopy, while pockets of stagnant, humid air gather in the dense foliage where ventilation never quite reaches. For decades, growers have managed this invisible landscape with a single sensor hanging near the center of the structure, an approach that works well enough when plants are small but becomes increasingly misleading as the canopy fills the growing volume. A new study published in Smart Agricultural Technology argues that this one-point monitoring strategy is no longer good enough, and it offers a data-driven alternative: a deep learning framework that turns dozens of cheap sensors into a continuous, three-dimensional, forward-looking map of the entire greenhouse microclimate.
The research, led by Dongyu Wang and colleagues, was conducted in a commercial-style solar greenhouse at Baiwang Plantation in Beijing’s Haidian District. Solar greenhouses are a distinctive form of protected agriculture widely adopted in northern China, built around an asymmetric single-slope design: a light-transmitting south-facing roof, a massive heat-storing north wall, and insulated sidewalls. This architecture allows vegetables to be grown through cold seasons with minimal external energy input, but it comes with a thermodynamic price. The enclosure’s uneven heating produces strong nonlinear fluctuations, pronounced time-lag effects, and sharp three-dimensional spatial heterogeneity in temperature, humidity, and radiation, all of which complicate any attempt to characterize the environment from a single measurement point.
To capture that heterogeneity directly, the team instrumented the greenhouse with 27 temperature and humidity sensors arranged in three experimental zones along the structure’s 80-meter length. In each zone, sensors formed a 3-by-3 horizontal grid with 2-meter spacing, mounted at three heights: 0.5, 1.0, and 1.5 meters above the ground. An outdoor weather station recorded air temperature, humidity, pressure, solar radiation, wind, and rainfall. Everything was logged at 15-minute intervals from April through July 2024, spanning a full cucumber growth cycle from transplanting to maturity, and yielding more than 386,000 valid observation records. The crop was grown in north-south double rows on large ridges with drip irrigation under plastic sheeting, a standard commercial configuration that makes the findings relevant to real production settings.
The monitoring data revealed just how dramatically the microclimate changes as the crop develops. During the seedling stage, when plants were short, temperature curves at different sensor nodes were nearly synchronized, with daytime peak differences of only about 1.4 to 1.8 degrees Celsius. At that point, a single central sensor was still a reasonably fair representative of the whole space. But as the plants grew to roughly 1.22 meters, vertical stratification emerged between the lower and middle layers, and daytime temperature differences among nodes widened to about 4 degrees. By the maturity stage, with plants reaching approximately 1.85 meters, the maximum instantaneous vertical temperature difference hit 8 degrees Celsius, while relative humidity at the canopy bottom frequently stayed above 85 percent. The lower canopy had effectively become a separate, humid, disease-friendly microclimate that a central sensor could not see.
That observation motivated the core of the study: a neural architecture the authors call CNN-BiLSTM-SA, which combines three complementary components. A multi-scale convolutional module first scans the raw sensor sequences with parallel one-dimensional kernels of different sizes. Small kernels capture high-frequency pulses caused by instantaneous ventilation events, while larger kernels track slow trends dominated by the diurnal cycle. A neighborhood enhancement step at the input stage lets each sensor’s signal incorporate information from its spatial neighbors, mitigating the context loss that comes from treating sensors as isolated points. The convolutional features are then passed to a bidirectional long short-term memory network, or BiLSTM, whose forward chain learns historical dynamics such as cooling after ventilation and whose backward chain incorporates future influences such as heat released by the north wall, addressing the thermal inertia and time lags inherent in greenhouse physics.
The most distinctive element is the sensor-level gated attention mechanism. Instead of averaging all measurement points equally, the model computes a dynamic weight for each sensor at each time step, based on both that sensor’s temporal feature vector and global meteorological context such as solar radiation and outdoor conditions. A Softplus mapping generates the weights, which are normalized and used to blend all sensor features into a single representation of the greenhouse’s instantaneous physical state. In effect, the network learns when and where to listen: during periods of strong environmental fluctuation, it can up-weight sensors in high-gradient boundary zones or humid canopy cores, and relax that focus when conditions are uniform. The authors also added physics-informed weak constraints to the training loss, penalizing implausible spatial jumps between adjacent sensors and unrealistic temperature inversions between vertical layers, so that predictions remain consistent with fluid-dynamical continuity rather than merely fitting the numbers.
The performance results are striking. On the held-out test set, CNN-BiLSTM-SA achieved a mean absolute error of 0.886 degrees Celsius, a root mean square error of 1.236 degrees, and a coefficient of determination of 0.92 for temperature prediction, along with a mean absolute error of 2.619 percent, a root mean square error of 3.735 percent, and an R-squared of 0.93 for humidity. Removing the attention mechanism degraded performance substantially: compared with an otherwise identical CNN-BiLSTM model, the full architecture cut temperature root mean square error by 26.6 percent and humidity error by 37.9 percent. The model also degraded gracefully with longer forecast horizons, with temperature error rising only from 1.236 to 1.439 degrees between 1-hour and 24-hour predictions, and humidity error from 3.735 to 4.548 percent, indicating stable day-ahead forecasting without sudden failure. Notably, an ablation with an overly strong physics constraint, at a regularization weight of one, caused humidity predictions to collapse, a cautionary demonstration that physical priors must be balanced against data fitting rather than imposed at full strength.
Beyond point predictions, the framework reconstructs continuous three-dimensional fields by combining inverse distance weighting interpolation with parabolic geometric masking. The resulting visualizations recovered physically meaningful structures: an east-west temperature gradient of up to 6.4 degrees aligned with solar radiation incidence and heat accumulation, a north-south contrast driven by differential light transmission through the covering materials, and a vertical stratification pattern with maximum differences of 7 degrees reflecting buoyancy-driven warm-air ascent. On the humidity side, the model correctly located concentrated high-humidity cores in the middle and lower canopy, where crop transpiration and restricted airflow trap water vapor, and identified drier zones near ventilation boundaries. Two-dimensional slice comparisons showed that adding the attention mechanism sharply reduced residual errors, which without it frequently exceeded 2 degrees and 6 percentage points near the southern film and in densely planted central regions. The authors acknowledge some remaining smoothing of local humidity extremes, a reminder that fields governed by tightly coupled transpiration, airflow, and vapor retention are harder to resolve than temperature alone.
The practical implications extend to sensor economics and the emerging concept of greenhouse digital twins. The full 27-sensor network served as a dense reference for model calibration, but the team tested reduced configurations: keeping only the nine lower-layer sensors increased temperature and humidity errors by 78.8 and 45.5 percent respectively, proving that vertical gradients cannot be captured from below the canopy alone. A optimized 24-sensor arrangement, however, raised errors by only 1.38 and 3.59 percent relative to the full network, suggesting that operational deployments can trim costs after site- and season-specific calibration. Looking forward, the authors propose integrating LiDAR-derived canopy structure and traits such as leaf area index, coupling the framework with radiation and carbon dioxide variables through physics-informed neural networks, and feeding the reconstructed fields into crop growth and disease-risk models. In such a system, ventilation and heating would no longer respond to an average number from a central sensor, but to the actual geography of risk inside the greenhouse, targeting the humid canopy cores where fungal pathogens take hold before any single-point alarm would ever sound.
Subject of Research: Deep learning-based spatiotemporal prediction and 3D reconstruction of temperature and humidity fields in solar greenhouses
Article Title: A multi-sensor deep learning framework for spatiotemporal prediction and three-dimensional reconstruction of temperature and humidity fields in solar greenhouses
Article References: A multi-sensor deep learning framework for spatiotemporal prediction and three-dimensional reconstruction of temperature and humidity fields in solar greenhouses. (n.d.). https://doi.org/10.1016/j.atech.2026.102517
Image Credits: AI Generated
DOI: 10.1016/j.atech.2026.102517
Keywords: solar greenhouse, deep learning, microclimate, temperature prediction, humidity prediction, attention mechanism, BiLSTM, convolutional neural network, precision agriculture, sensor networks, digital twin, spatial heterogeneity
Cite Scienmag News
Blake Davidson. (September 30, 2026). Deep Learning Map Gives Greenhouses a Live 3D View of Heat and Humidity. Scienmag. https://scienmag.com/deep-learning-map-gives-greenhouses-a-live-3d-view-of-heat-and-humidity/
Blake Davidson. "Deep Learning Map Gives Greenhouses a Live 3D View of Heat and Humidity." Scienmag, 30 September 2026, https://scienmag.com/deep-learning-map-gives-greenhouses-a-live-3d-view-of-heat-and-humidity/. Accessed 30 September 2026.
Blake Davidson. "Deep Learning Map Gives Greenhouses a Live 3D View of Heat and Humidity." Scienmag. September 30, 2026. https://scienmag.com/deep-learning-map-gives-greenhouses-a-live-3d-view-of-heat-and-humidity/


