

Drone-Mounted Lidar Offers a Fast New Window Into Forest Biodiversity
As biodiversity collapses under pressure from land-use change, climate-driven disturbances, wildfires, windstorms and pest outbreaks, scientists are searching for ways to monitor the living complexity of forests without having to identify every organism by hand. A study in southwestern France suggests that drone-mounted lidar could provide one of the most practical routes yet. By scanning narrow strips of broadleaved vegetation hidden inside a vast landscape of intensively managed pine plantations, researchers tested whether three-dimensional measurements of vegetation could predict biodiversity across multiple groups of animals and plants. The results point to a striking possibility: the shape and density of a hedgerow, measured remotely by laser pulses, may act as a rapid ecological “fingerprint” for the species it supports. The approach does not replace field surveys, but it could help managers identify the most valuable habitats across thousands of kilometres of forest before deciding where conservation work is most urgently needed.
The research took place in the Landes de Gascogne Forest, a roughly one-million-hectare region in southwestern France dominated by plantations of maritime pine, Pinus pinaster. Within this relatively uniform coniferous matrix are remnants of native broadleaved vegetation, including hedgerows, riparian forests and woodland strips bordering roads, tracks and drainage ditches. These features are often composed largely of pedunculate oak, Quercus robur, and Pyrenean oak, Quercus pyrenaica, with common alder added in wetter areas. Although they may be narrow, such linear habitats can create environmental conditions very different from those beneath pure pine stands. Their layered vegetation, shade, leaf litter, cavities and dead branches can provide food, shelter and breeding sites for organisms that would otherwise find the plantation landscape difficult to inhabit. The hedgerows can also function as corridors, allowing animals and plants to move through an otherwise simplified forest.
The team worked within the Forest Bocage Living Lab, a 50,000-hectare collaborative project involving scientists, forest managers and policymakers. The project is investigating whether broadleaved hedgerows can serve as a nature-based solution for making pine plantations more resilient to climate-related disturbances while conserving biodiversity. Researchers identified approximately 430 kilometres of ancient hedgerows in the study area using high-resolution infrared aerial imagery. From this network, they selected 24 hedgerows dominated by native oaks and taller than eight metres. Each was assessed along a standardized 100-metre transect, allowing measurements of vegetation structure, biodiversity and tree-related microhabitats to be compared on the same spatial scale. Two hedgerows were later excluded because technical problems prevented complete lidar coverage, leaving 22 sites for the statistical analysis. The relatively small sample made careful modelling essential, because many structural measurements—such as canopy cover, plant height and vegetation density—are naturally correlated.
To determine what the hedgerows actually contained, the researchers surveyed six taxonomic groups during 2023: understorey plants, butterflies, ground-dwelling carabid beetles, ground-dwelling spiders, birds and reptiles. The survey deliberately covered organisms spanning different trophic positions, from primary producers to predators, and included species known to respond to habitat structure. Plants, butterflies and reptiles were recorded along transects, while beetles and spiders were collected using pitfall traps. Birds were monitored with passive acoustic recorders, with experts identifying species from their calls. The scientists also separated forest specialists from generalists using literature-based classifications at French or European scales. To combine the results, they calculated a multidiversity index. For each taxonomic group, species richness was scaled to the highest value observed among the sites, and the six standardized values were averaged so that no single group dominated the final score. A second index focused specifically on forest specialists; reptiles were excluded from that calculation because all five reptile species recorded were classified as generalists.
The researchers also examined tree-related microhabitats, or TreMs—small but ecologically important structures found on living and dead trees. These include cavities, exposed or injured wood, dead branches in the crown, fungal fruiting bodies, slime moulds, epiphytes, tree excrescences and fresh sap flows. Although they can appear insignificant from the ground, TreMs are often essential resources for organisms during part of their life cycle. Cavities may shelter birds, bats and insects; decaying wood supports saproxylic beetles and fungi; and ivy or other epiphytic structures can provide habitat for arthropods. Two trained observers inspected every living tree larger than 7.5 centimetres in diameter along each 100-metre transect, examining both trunks and crowns with binoculars. The team used a standardized classification system containing 52 microhabitat types. TreM abundance was defined as the total number of recorded microhabitat types, while TreM diversity was the number of different types present. These measures offered an indirect way to test whether remotely detected structural complexity was linked to the specialized resources required by forest organisms.
The remote survey used airborne laser scanning from a DJI Matrice 300 RTK drone equipped with a Zenmuse L1 lidar sensor. Lidar works by emitting rapid pulses of near-infrared light and measuring how long they take to return after striking leaves, branches, trunks or the ground. Because many pulses pass through gaps in vegetation, the resulting point cloud can represent the full vertical profile of a habitat rather than merely its outer surface. In this study, the scans produced between 270 and 1,540 points per square metre, allowing the researchers to distinguish the canopy from the shrub layer and lower vegetation. Ground points were classified computationally and used to build a digital terrain model with two-metre resolution. Each return was then converted into height above the ground, and points collected at extreme scan angles were removed to reduce bias in canopy-cover estimates. The scientists focused on 12 biologically motivated metrics, including average and variable canopy cover, shrub cover, total vegetation cover, mean and maximum height, height variability and the 95th-percentile height. They also calculated the plant area index, or PAI, from canopy openness using PAI = −ln(1 − μtc), where μtc is mean total cover. PAI acts as a lidar-based proxy for the amount of plant material occupying a vertical column and is related to the basal area of trees.
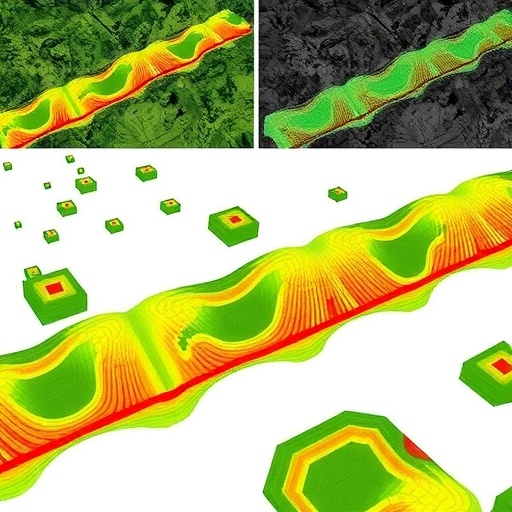
One of the most important advantages of the drone data was its ability to measure how vegetation changed along the length of a hedgerow. Instead of treating a 100-metre strip as a single uniform block, researchers divided each hedgerow into spatial polygons using Voronoi tessellation, with centres at least 10 metres apart. This typically produced eight sections per hedgerow. For every section, the lidar returns were classified into total vegetation above one metre, shrub vegetation between one and five metres, and canopy vegetation above five metres. The mean of these measurements described the overall structure, while their variability described how patchy or heterogeneous the hedgerow was. The team also quantified horizontal variability in vertical structure by first calculating the variation in height within each polygon and then measuring how much that variation differed among polygons. Ground measurements used a much coarser design: three quadrats per hedgerow for canopy, shrub and total cover, three width measurements and ten oak-height measurements. This comparison allowed the researchers to ask whether lidar’s dense, spatially continuous sampling provided more useful ecological information than conventional field measurements.
The statistical analysis combined partial least squares regression with model selection to deal with the small number of hedgerows and the strong correlations among lidar variables. Partial least squares regression creates latent components that summarize predictor variables while retaining the information most closely associated with a response, making it useful when measurements such as height, cover and plant area index overlap heavily. The researchers evaluated predictive performance using leave-one-out cross-validation and the root mean squared error of prediction. Variables with a variable-importance-in-projection score above one were treated as influential candidates, after which collinear predictors were removed using a variance-inflation threshold of five. Final linear or generalized linear models were then selected with corrected Akaike information criteria. In the results available from the study, variability in total vegetation cover emerged as the lidar predictor retained for overall multidiversity. Its model explained 28 per cent of the adjusted variation in the combined richness index and had a coefficient of 0.64 ± 0.21, with a reported probability value of 0.007. Mean canopy cover was the retained lidar predictor for multidiversity of forest specialists, with a coefficient of 0.50 ± 0.12. Together, these findings suggest that biodiversity in narrow broadleaved habitats may depend not simply on how much vegetation exists, but on how that vegetation is distributed and layered through space.
The study’s broader significance lies in turning ecological complexity into something that can be mapped quickly and repeatedly. Traditional biodiversity monitoring remains indispensable, particularly for discovering rare species and confirming cause-and-effect relationships, but it is labour-intensive and requires taxonomic expertise. A drone can scan a hedgerow in minutes, capturing thousands of structural observations that would be impossible to collect manually at the same density. If those measurements reliably predict multidiversity or the presence of TreMs, managers could use lidar maps to prioritize restoration, protect mature broadleaved strips and identify gaps in habitat corridors across plantation landscapes. The method could also be applied after storms, fires or pest outbreaks to determine which structural features survived and where biodiversity refuges remain. However, lidar cannot directly reveal species identity, ecological interactions or whether an animal merely passed through a habitat. Its predictive power may also vary among regions, forest types and taxonomic groups. The French study therefore presents lidar not as a replacement for field biology, but as a scalable early-warning and screening system—one capable of revealing where the hidden architecture of forests may be sustaining life.


