


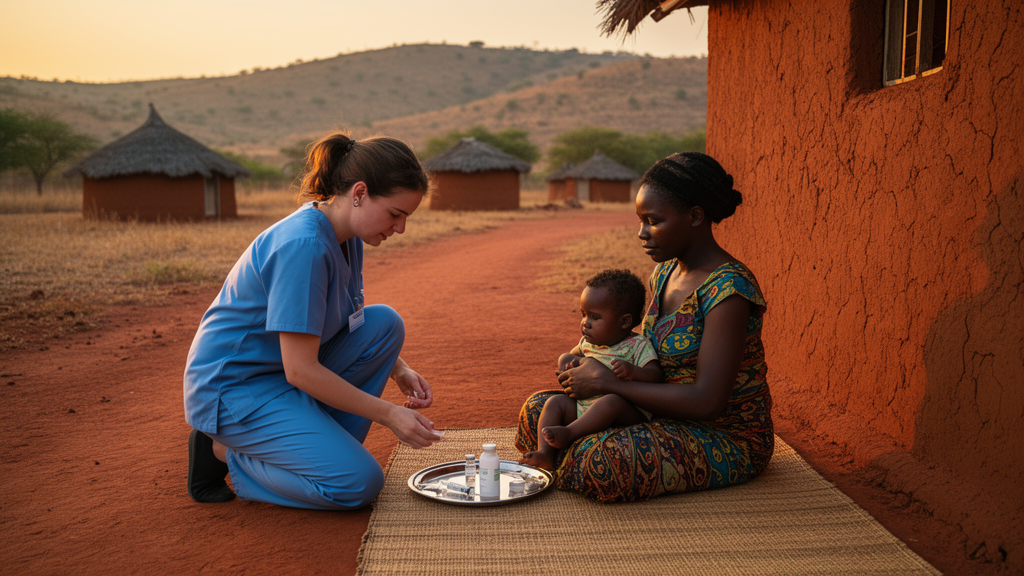
Some of the world’s most consequential public health questions hide inside a deceptively simple statistic: which children have never received a single dose of routine vaccines. These zero-dose children, concentrated overwhelmingly in disadvantaged populations, are the central target of the global immunization agenda, and governments and donors have long debated where the deepest pockets of disadvantage actually lie. Is inequality in zero-dose prevalence driven mainly by household wealth, by how far mothers went in school, by the rural–urban divide, or by the region of the country a child happens to be born in? A new analysis published in the International Journal for Equity in Health offers the most systematic answer yet, and its conclusion is more nuanced than any single label can capture.
Han Qiu of Beijing University of Chinese Medicine and Yue Zhong of Wuhan University assembled an unusually large evidence base: 339 eligible country–year surveys from 86 countries, conducted between 1993 and 2023 and drawn from the WHO Health Inequality Data Repository. For each survey, they measured inequality in zero-dose prevalence along four stratifiers—household wealth, maternal education, place of residence, and subnational region. The technical challenge they confronted is one that has plagued cross-country comparisons for years. These stratifiers do not divide a population into comparable pieces. Wealth quintiles split households into five groups, education categories may number three or four, urban and rural residence yields two, while subnational regions can range from a handful to dozens of administrative units with wildly different population sizes. Comparing inequality measures across stratifiers with different group counts and group populations risks rewarding whichever dimension happens to be sliced most finely.
To level the playing field, the researchers used a single descriptive statistic for all four stratifiers: the population-weighted between-group standard deviation of subgroup-specific zero-dose prevalence. In plain terms, this measure captures how widely zero-dose prevalence scatters across the constituent groups of a given stratifier, weighted by how many children live in each group. A large between-group standard deviation means some groups carry far higher zero-dose prevalence than others along that dimension. For each survey, the stratifier with the largest value was classified as the leading observed inequality dimension. The approach deliberately treats the comparison as descriptive rather than causal, a distinction that turns out to matter enormously for how the results should be used.
The headline finding is that geography dominates more often than any other dimension. Subnational region was the leading observed inequality dimension in 209 of the 339 surveys, or 61.7 percent. Household wealth led in 67 surveys (19.8 percent), maternal education in 61 (18.0 percent), and place of residence in just 2 (0.6 percent). The urban–rural divide, long a staple of health equity discourse, was almost never the largest observed source of zero-dose inequality once it competed on equal footing with the other stratifiers. Regional dispersion, in other words, is where the deepest between-group gaps in unvaccinated children are most frequently found.
But the study’s most important contribution may be its refusal to stop at that headline. The authors recognized that identifying a leading dimension from survey data is itself a statistical act subject to sampling error. Subgroup prevalence estimates come with standard errors, and when two stratifiers produce similar between-group standard deviations, the ranking between them may be little more than noise. To quantify this fragility, they ran 5,000 parametric simulations for each survey, resampling from the reported subgroup standard errors and recording how often each stratifier emerged as the leading dimension. A survey was considered to have an uncertain classification if the maximum simulated probability of any single leading dimension fell below 0.80.
The results of that uncertainty analysis are sobering. Only 145 surveys, or 42.8 percent, had a maximum simulated leading-dimension probability of at least 0.80. In well over half of the surveys, the identity of the leading inequality dimension could not be stated with reasonable confidence. This does not mean the underlying data are poor; it means that when multiple dimensions of disadvantage overlap—as wealth, education, and geography so often do—the survey sample sizes available for subgroup estimates are often insufficient to declare a clear winner. The authors’ framing is careful: the numerically largest dimension does not necessarily represent the most appropriate intervention target, and a leading-dimension label should never be mistaken for a causal mechanism.
The team stress-tested their conclusions from every direction. Across six alternative inequality measures, the proportion of region-led surveys ranged from 50.1 percent to 70.5 percent, confirming that the regional pattern is not an artifact of one particular statistic. When countries were weighted equally rather than by survey count, the regional share remained similar at 62.5 percent (95 percent CI, 54.9–70.1). When only the most recent survey from each country was retained, the share rose modestly to 68.6 percent (95 percent CI, 59.3–77.9). Adding child sex and, where available, maternal age as additional stratifiers did not change the original classifications. One sensitivity finding deserves particular attention: regional dispersion was positively associated with the number of reported subnational regions, with a Spearman correlation of 0.355 (p < 0.001). Countries that carve themselves into more administrative units tend to show larger between-region dispersion, a reminder that the regional stratifier is partly a function of how a country chooses to draw its internal boundaries.
Stability over time proved equally elusive. Among the 66 countries with repeated surveys, 37—56.1 percent—changed their leading dimension at least once between survey rounds. A country whose zero-dose inequality appeared wealth-driven in one decade might appear region-driven in the next, not necessarily because the underlying social structure transformed, but because sampling variation, changing administrative boundaries, and shifting demographic patterns all conspire to move the ranking. The practical implication is direct: any single-snapshot assessment of where disadvantage is concentrated should be treated as provisional, and repeated multidimensional assessment is needed to track where zero-dose children actually cluster as circumstances evolve.
The authors conclude that subnational region should be interpreted as a composite spatial stratifier rather than an independent causal mechanism. Regions bundle together everything that varies across a country’s territory—local health system capacity, road access, conflict, climate, cultural practices, local wealth and education levels—so a large between-region dispersion signals that disadvantage is spatially clustered without specifying which ingredient drives it. For immunization programs, this cuts both ways. Region-led inequality suggests that geographically targeted outreach, subnational microplanning, and region-specific supply chains could reach many zero-dose children efficiently. Yet because the classification was uncertain in most surveys and unstable in half of countries with repeated data, programs should avoid anchoring their entire strategy to whichever dimension happened to top a single survey’s ranking.
For a global health community racing to reach the children the routine system has missed, the study offers both a map and a warning. The map points to geography: in roughly six in ten surveys across 86 countries and three decades, the widest gaps in zero-dose prevalence fall along regional lines, dwarfing the familiar wealth and education gradients and rendering the rural–urban binary nearly irrelevant as a leading dimension. The warning is about certainty: in most surveys the leading dimension could not be identified with confidence, and in most countries with longitudinal data it changed over time. Zero-dose disadvantage is real, measurable, and most often spatially concentrated—but pinning it to a single permanent label, the analysis makes clear, is a luxury the data rarely afford. The path forward the authors describe is neither glamorous nor simple: keep measuring, keep comparing dimensions, and keep revising the picture of where the unvaccinated live as new evidence arrives.
Subject of Research: Zero-dose vaccination inequality across 339 surveys in 86 countries
Article Title: Subnational regional dispersion in zero-dose vaccination: a multidimensional comparison across 339 country–year surveys
Article References: Subnational regional dispersion in zero-dose vaccination: a multidimensional comparison across 339 country–year surveys. (n.d.). https://doi.org/10.1186/s12939-026-03064-x
Image Credits: AI Generated
DOI: 10.1186/s12939-026-03064-x
Keywords: zero-dose children, vaccination inequality, subnational regions, health equity, immunization, Subnational, regional, dispersion, zero-dose, vaccination, multidimensional, comparison
Cite Scienmag News
Courtney Benton. (October 15, 2026). Where Zero-Dose Children Live: Geography Tops Wealth and Education in Vaccine Gaps. Scienmag. https://scienmag.com/where-zero-dose-children-live-geography-tops-wealth-and-education-in-vaccine-gaps/
Courtney Benton. "Where Zero-Dose Children Live: Geography Tops Wealth and Education in Vaccine Gaps." Scienmag, 15 October 2026, https://scienmag.com/where-zero-dose-children-live-geography-tops-wealth-and-education-in-vaccine-gaps/. Accessed 15 October 2026.
Courtney Benton. "Where Zero-Dose Children Live: Geography Tops Wealth and Education in Vaccine Gaps." Scienmag. October 15, 2026. https://scienmag.com/where-zero-dose-children-live-geography-tops-wealth-and-education-in-vaccine-gaps/


