


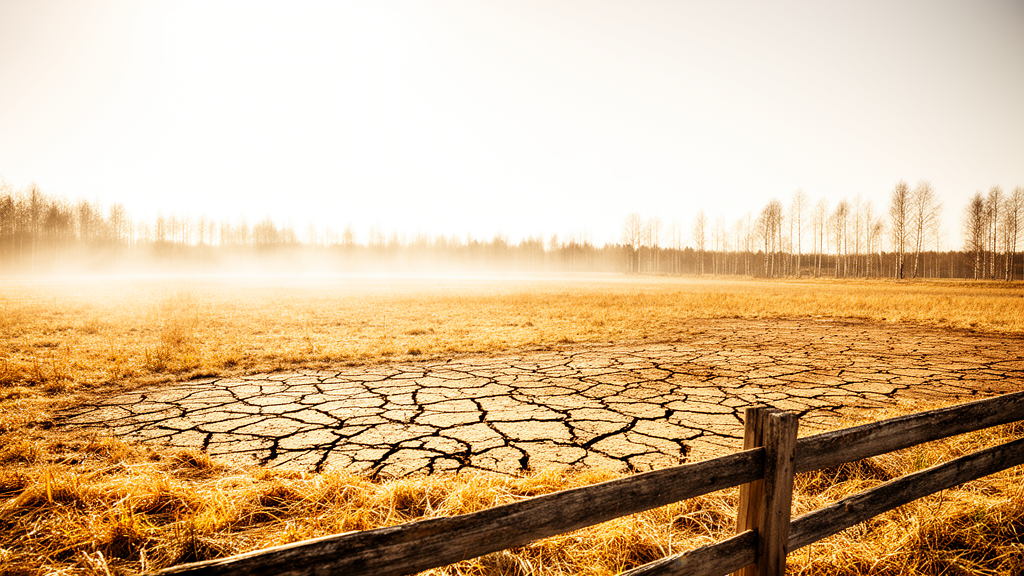
In the summer of 2018, southern and central Sweden endured one of the most remarkable heat episodes in its recorded history. A stubborn high-pressure system parked over the British Isles and the North Sea set the stage, but new research suggests that the land itself helped write the script. A study published in Advances in Statistical Climatology, Meteorology and Oceanography by Iris Mužić of the Center for International Climate Research in Oslo and her colleagues has, for the first time, dissected the day-by-day mechanics of soil moisture–temperature coupling during that sweltering May-to-August period, using a state-of-the-art coupled regional climate model and an independent observational dataset. The findings reveal how a landscape that is normally energy-rich and water-abundant can flip into a regime where drying soils actively amplify the heat above them.
The physical mechanism at the heart of the study is known as soil moisture–temperature coupling, or SM–T for short. Under the classic Budyko framework, high-latitude regions like Sweden sit firmly in the wet climate regime: evaporation there is limited not by how much water the soil holds but by how much energy the sun supplies. When soils are wet, incoming solar radiation is largely consumed by evaporating water, a process that cools the surface. But when enhanced warming drives soil moisture below a critical, non-stationary threshold, the system can shift into a transitional regime. There, rising temperatures deplete soil water, evaporation declines, and the energy that once went into vaporizing water is instead funneled into heating the air. This positive feedback can significantly magnify the intensity of an initial temperature extreme, turning a hot spell into a full-blown heatwave.
Sweden in 2018 offered a textbook case. The meteorological drought that began in late spring rapidly progressed into an agricultural drought as soil water reserves collapsed, and ultimately into a hydrological drought marked by reduced streamflow and groundwater storage. Such cascades are common in the mid-latitudes but highly unusual in the generally moisture-abundant high latitudes, which is precisely why the event attracted so much scientific attention. Previous work by Paul Dirmeyer and colleagues had already shown, using in situ and reanalysis data, that soil moisture–temperature coupling amplified the strength of the 2018 drought and heatwave in this very region. What remained unclear was exactly how long the coupling persisted, how much territory it covered, and which parts of the feedback chain mattered most.
To answer those questions, the team deployed WRF-CTSM, a recently developed coupling of the Weather Research and Forecasting atmospheric model with the Community Terrestrial Systems Model, the land surface component that corresponds to the Community Land Model version 5. Both components rank among the most sophisticated models in their respective domains. The researchers ran four simulations for 2018 at 10.5-kilometer horizontal resolution over a domain covering Norway, Sweden, and Finland, all initialized and nudged at the boundaries with the ERA5 reanalysis. The simulations differed in their land surface configurations: the reference run followed an earlier model setup, while subsequent runs successively incorporated a newer model version, the Medlyn stomatal conductance scheme, twenty hydrologically active soil layers reaching 8.6 meters deep, subgrid plant functional type heterogeneity, a plant hydraulic stress configuration that resolves water potential from roots to leaves, and finally a biomass heat storage scheme that accounts for the substantial thermal inertia of tree stems and leaves.
Benchmarking these simulations demanded independent evidence. The team drew on eddy-covariance flux tower observations from five ICOS stations within the study area, including Lanna, Norunda, Hyltemossa, Rosinedal-3, and Degerö, which provide daily measurements of surface soil moisture, sensible and latent heat fluxes, maximum two-meter temperature, precipitation, and net radiation. They supplemented these ground truth data with the European Space Agency’s Climate Change Initiative satellite soil moisture product and constructed a merged dataset called GLEAM-E-OBS, combining the Global Land Evaporation Amsterdam Model version 4.1a with the E-OBS gridded station-based product, both at a 0.1-degree grid spacing comparable to the model output. Crucially, the newest GLEAM release provides sensible heat flux for the first time, enabling the calculation of evaporative fraction, the ratio of latent heat to total turbulent energy exchange, which serves as a key indicator of land surface dryness.
The evaluation showed that the models and the merged dataset captured the magnitude and variability of the key coupling variables with impressive fidelity. Daily maximum temperature correlations against station observations reached 0.99 across all evaluated datasets. Surface soil moisture in the newer model runs aligned closely with both the towers and the satellite product, while the reference run ran noticeably dry, underestimating soil moisture by roughly 0.1 cubic centimeters per cubic centimeter at the station locations. Evaporative fraction proved the hardest variable to reproduce, as it fluctuates with intermittent cloudiness and local surface conditions. The newest configuration, incorporating both plant hydraulics and biomass heat storage, delivered the best overall performance, and it reduced summertime maximum temperatures over densely forested areas by up to 0.6 degrees Celsius by damping the diurnal temperature swing in ways that better match reality.
For the coupling analysis itself, the researchers devised a multi-correlation overlay approach built on 92-day running windows. Complete coupling was declared present only when three correlation conditions held simultaneously: a negative correlation between maximum temperature and surface soil moisture, a positive correlation between soil moisture and evaporative fraction, and a negative correlation between evaporative fraction and maximum temperature, all co-occurring with a rising temperature trend. This three-legged definition, adapted from Dirmeyer’s two-legged coupling metric, deliberately avoids reliance on critical soil moisture thresholds, which vary over time and are difficult to pin down. It also excludes cases where reduced evaporation stems purely from atmospheric dryness or plant stomatal closure without genuine soil moisture limitation, ensuring that only true transitions into the moisture-limited evaporation regime count.
The headline result is striking in its simplicity: averaged across the study region and all five datasets, complete soil moisture–temperature coupling persisted for 22 days during the May-to-August 2018 period. The individual legs of the feedback told a more nuanced story. The correlation between maximum temperature and soil moisture alone persisted for 72 days on average, and the soil moisture–evaporative fraction link for 42 days, but the atmospheric leg linking evaporative fraction to temperature lasted only 25 days. Yet that shortest-lived component turned out to be the gatekeeper: it coincided with the other two conditions 92 percent of the time, meaning that counting days in the atmospheric leg alone predicts the full coupling duration with high, though not definitive, probability. Geographically, the coupling concentrated in southeastern Sweden, where reduced evaporative fraction persisted longest and where some locations logged up to 30 consecutive heatwave days.
Differences among the datasets were revealing. GLEAM-E-OBS showed coupling over most of the region lasting 32 days on average, while the model simulations covered smaller areas and lasted 17 to 23 days, partly because the model overestimated precipitation during the dry period, injecting moisture pulses that shortened the feedback. Notably, unlike the merged observational product, WRF-CTSM correctly captured the anomalous character of 2018 relative to other years, which the authors attribute to its richer representation of vegetation physiology, including compensatory root water uptake from deeper soil layers during water stress, a process that field observations confirmed even in shallow-rooted spruce. Canopy transpiration emerged as the dominant component of total evaporation in this needleleaf-forest-dominated landscape, declining sharply in early July as the feedback intensified.
The implications reach well beyond one Scandinavian summer. Soil moisture–temperature interactions modify the surface energy balance in ways that can accelerate warming in Earth system models, so representing the coupling accurately directly affects projections of future heat extremes. As compound hot and dry events become more likely with global warming, and as high-latitude regions increasingly shift from energy-limited to moisture-limited evaporation during hot summers, understanding when and where the land amplifies the atmosphere becomes essential for seasonal forecasting, agricultural planning, and climate risk assessment. This study demonstrates that a coupled regional model with detailed plant hydraulics and heat storage physics can reproduce the anatomy of a land-atmosphere feedback with credible precision, while also highlighting how much local-scale timing and duration still elude even the best tools. The authors caution that their analysis covers a single event, and that applying the same framework to additional heatwaves will be needed to confirm the patterns, but the message is clear: the ground beneath a heatwave is not a passive victim. It is an active accomplice, and knowing when it joins the conspiracy may be one of the keys to anticipating the extremes of a warming world.
Subject of Research: Soil moisture–temperature coupling during the May–August 2018 heatwave in southern and central Sweden, analyzed with the WRF-CTSM coupled regional climate model and observational datasets
Article Title: Soil moisture–temperature coupling during extreme warm conditions in 2018 in Sweden: a case study with WRF-CTSM
Article References: Mužić, I., Hodnebrog, Ø., Yilmaz, Y. A., Berntsen, T. K., Sillmann, J., Lawrence, D. M., & Dirmeyer, P. A. (2025). Soil moisture–temperature coupling during extreme warm conditions in 2018 in Sweden: a case study with WRF-CTSM. Advances in Statistical Climatology, Meteorology and Oceanography, 11(2), 273-292. https://doi.org/10.5194/ascmo-11-273-2025
Image Credits: AI Generated
DOI: 10.5194/ascmo-11-273-2025
Keywords: soil moisture, temperature coupling, heatwave, Sweden 2018, land-atmosphere interactions, WRF-CTSM, evaporative fraction, drought, regional climate modeling, plant hydraulics, GLEAM, climate extremes
Cite Scienmag News
Sloane Callahan. (October 9, 2026). When Dry Ground Turns Up the Heat: Inside Sweden’s 2018 Heatwave Feedback Loop. Scienmag. https://scienmag.com/when-dry-ground-turns-up-the-heat-inside-swedens-2018-heatwave-feedback-loop/
Sloane Callahan. "When Dry Ground Turns Up the Heat: Inside Sweden’s 2018 Heatwave Feedback Loop." Scienmag, 9 October 2026, https://scienmag.com/when-dry-ground-turns-up-the-heat-inside-swedens-2018-heatwave-feedback-loop/. Accessed 9 October 2026.
Sloane Callahan. "When Dry Ground Turns Up the Heat: Inside Sweden’s 2018 Heatwave Feedback Loop." Scienmag. October 9, 2026. https://scienmag.com/when-dry-ground-turns-up-the-heat-inside-swedens-2018-heatwave-feedback-loop/


