


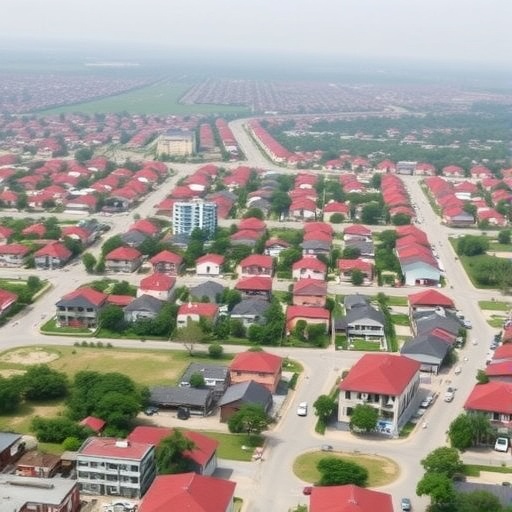
In the fast-growing municipality of Savelugu in northern Ghana, some of the most consequential neighbours are the ones nobody can see. Beneath an unremarkable strip of ground, an underground petroleum pipeline runs through land that was once open peri-urban fringe, and year after year the houses, shops and compound walls of a spreading population have been pressing closer to it. A study published on 29 August 2026 in the open-access journal Discover Sustainability has now measured that slow-motion collision with unusual precision. Fuseini Nyagsi Abdul Gafaru, Dzigbodi Adzo Doke and Samuel Jerry Cobbina, researchers at the University for Development Studies and the West African Centre for Water, Irrigation and Sustainable Agriculture in Ghana, combined satellite imagery spanning 2008 to 2024 with reconstructed pipeline geometry to track digitised built structures along the corridor. Their verdict is stark: even as the wider settlement boomed, buildings increasingly clustered into the most hazardous proximity bands, and the number of structures inside the highest-exposure zone grew nearly fivefold, from 33 in 2008 to 159 by 2024.
The problem the study targets is one of the least glamorous and most consequential in modern urban planning. Across much of the Global South, cities are expanding outward faster than governments can map, zone or police, and linear infrastructure — pipelines, transmission lines, railways — is often the last consideration when new plots are carved out. Petroleum pipelines are particularly insidious in this respect, because once a right-of-way is grassed over it is effectively invisible: a corridor that exists on paper but has no physical presence on the ground. Developers see cheap, well-connected land; planning authorities with limited monitoring capacity may see nothing at all. The authors note that proximity-based zoning frameworks are widely used to delineate infrastructure safety corridors, but that they are commonly applied as static regulatory thresholds — fixed lines drawn once and rarely revisited. Such static lines cannot say whether a corridor is becoming safer or more dangerous over time, which is precisely the question that matters when a city is growing toward its own fuel supply.
To capture that dynamic, the team built what they describe as a reproducible geospatial workflow around three ingredients. The first was multitemporal satellite imagery covering 2008 through 2024, allowing the researchers to reconstruct the built environment at multiple points across sixteen years of growth. The second was reconstructed pipeline alignment data — a best estimate of where the buried pipe actually runs, essential because a few metres of positional error can move a building between exposure categories. The third was the digitisation of built structures within the study area, so that buildings could be counted, located and tracked as the years advanced. Crucially, the researchers did not treat the pipeline as a simple line on a map. They densified the pipeline’s reference geometry, breaking the reconstructed route into a dense chain of closely spaced reference points, so that the distance from every structure could be computed to the nearest point along the true continuous trace of the corridor rather than to a handful of sparse map vertices.
Proximity alone, however, does not equal risk, and this is where the study borrows a concept from pipeline engineering: the Potential Impact Radius, or PIR. In pipeline safety analysis, the PIR is the distance from a pipeline within which a failure could plausibly exert damaging consequences on people and property, conventionally derived from the pipe’s physical characteristics and operating conditions. Rather than drawing a single circle, the researchers used the PIR framework to derive graded exposure zones — a set of nested bands around the pipeline, each representing a different level of potential consequence should the line ever be breached. A building metres from the pipe falls into the highest-exposure band; a building near the outer edge of the corridor falls into a lower one. By classifying every digitised structure into these graded zones for each stage of the record, the team converted the 2008–2024 imagery into a longitudinal picture of how exposure around the corridor was evolving year by year.
The centrepiece is the index itself: the Proximity-Based Risk Index, or PBRI. Conceptually, the PBRI does two things at once. First, it weights built-structure counts by their proximity, so that a house standing close to the pipeline contributes far more to the index than a house at the corridor’s edge — the metric is sensitive to where new construction lands, not merely how much of it there is. Second, it applies temporal normalisation, adjusting the proximity-weighted counts so that values from different years are comparable even as the total number of buildings multiplies. That normalisation is what allows the PBRI to detect redistribution rather than raw growth: a corridor could add thousands of new buildings while becoming proportionally safer if they all landed far from the line, or grow modestly yet become more dangerous if new construction huddled close to the pipe. The result is a single longitudinal screening metric that rises or falls as the balance of exposure shifts — exactly the kind of number a data-scarce municipality can compute, track and compare over time.
Applied to Savelugu, the index told a consistent and statistically convincing story. The PBRI stood at 1.035 in 2008, climbed to a peak of 1.074 in 2021 and registered 1.072 by 2024 — numbers that look small but conceal a strong and steady upward drift. To test whether that drift was real, the researchers turned to Mann–Kendall trend analysis, a non-parametric statistical test that checks whether a time series moves monotonically in one direction. The result was emphatic: a Kendall’s tau of 0.889 with a p-value of 0.0012, indicating a statistically significant monotonic trend — about as clean a signal as such tests deliver. The team complemented the test with Sen’s slope estimation, a robust technique that computes the median of all pairwise slopes in the series, yielding a resistant estimate of the trend’s magnitude that individual anomalous years cannot easily distort. Together, the two methods confirmed that the rise of the PBRI reflected a genuine, sustained intensification of exposure rather than noise in any single year’s imagery.
The spatial anatomy of the trend is what makes it alarming. While the municipality experienced substantial overall urban growth, that growth was not distributed evenly with respect to the pipeline: kernel density analysis, a technique that converts point locations into a smooth surface and reveals where concentrations form, showed progressively tighter clustering along the corridor itself. Because kernel density surfaces weight nearby structures more heavily than distant ones, they are especially good at exposing hotspots of development — and in Savelugu, the hotspots aligned, year after year, with the corridor. Structures were not simply multiplying everywhere; they were gravitating toward the higher-exposure bands. The starkest evidence sits in the top zone. In 2008, 33 buildings occupied the highest-exposure zone closest to the pipeline. By 2024, that count had reached 159 — a nearly fivefold multiplication of the structures standing nearest to a buried petroleum conduit. In effect, the municipality’s development frontier spent sixteen years marching directly toward the least safe location available to it, one plot at a time.
None of this requires an actual failure to matter. Proximity around a petroleum pipeline is a proxy for consequence: the closer a building stands, the worse the outcome if the line is breached, whether through corrosion, third-party damage or operational failure. Encroachment compounds the problem in quieter ways as well. Dense construction over or beside a right-of-way complicates routine monitoring, restricts access for maintenance crews and emergency responders, and multiplies the number of people living inside the zone where a release and ignition event would be most damaging. The authors are careful to position their index honestly. The PBRI, they write, is an exposure-monitoring and screening tool for data-scarce peri-urban environments rather than a predictive risk model: it does not forecast where or when a failure will occur, nor does it calculate probabilities of ignition. What it does is answer a different and more tractable question — is human exposure around this corridor intensifying, and how quickly — using freely available imagery and methods that any competent analyst can repeat.
That distinction is what makes the study useful far beyond one corridor in northern Ghana. For authorities in rapidly urbanising Global South cities, the binding constraint is rarely awareness that encroachment happens; it is the absence of affordable, repeatable measurement. Fixed regulatory buffers, the kind most planning codes specify, degrade silently as settlements grow, and by the time encroachment is obvious on the ground, the land carries titles, tenants and politics. A screening index built from satellite imagery, reconstructed alignment data and digitised structures offers a way to catch the drift early — to see, in numbers, that a corridor is becoming more exposed while intervention is still cheap and administratively simple. The authors frame this as corridor-sensitive infrastructure governance: a monitoring philosophy that treats the pipeline not as a line on an old map but as a dynamic exposure gradient, whose surroundings must be tracked and managed continuously as the city presses in.
The Savelugu numbers read as a case study in a challenge that will define infrastructure safety for decades. The world’s fastest urban growth is happening precisely where much of its energy infrastructure was laid through farmland that nobody expected to see rooftops, and every such corridor is a potential Savelugu. The fivefold multiplication of buildings in the highest-exposure zone did not arrive as a dramatic event; it accumulated one house at a time, each individually rational, none individually alarming. What the PBRI provides is a way of making that accumulation visible — a single, statistically defensible number that climbs while there is still time to steer development around the pipe. As the researchers show, the signal was there all along, rising quietly in the satellite record from 2008 onward. Now that it can be measured, the harder work of acting on it begins.
Cite Scienmag News
Violet Maxwell. (August 29, 2026). Urban sprawl increasingly threatens Ghana’s oil pipelines, proximity index reveals. Scienmag. https://scienmag.com/urban-sprawl-increasingly-threatens-ghanas-oil-pipelines-proximity-index-reveals/
Violet Maxwell. "Urban sprawl increasingly threatens Ghana’s oil pipelines, proximity index reveals." Scienmag, 29 August 2026, https://scienmag.com/urban-sprawl-increasingly-threatens-ghanas-oil-pipelines-proximity-index-reveals/. Accessed 3 September 2026.
Violet Maxwell. "Urban sprawl increasingly threatens Ghana’s oil pipelines, proximity index reveals." Scienmag. August 29, 2026. https://scienmag.com/urban-sprawl-increasingly-threatens-ghanas-oil-pipelines-proximity-index-reveals/


