


In the race to predict floods, snowmelt and seasonal water supplies, artificial intelligence has often been judged by a single question: how closely can a model match the river gauge? A new study argues that this approach misses a crucial part of the science. In the Goose River watershed, a cold-region agricultural basin in the northern United States, researchers systematically tested where predictive skill actually comes from—weather, landscape characteristics, the basin’s memory of previous flows, or the physical connections between upstream and downstream areas. Their results show that the most accurate model was not necessarily the one that offered the clearest picture of how water moves through a watershed. Instead, the work reveals a striking trade-off between numerical precision and hydrologic realism, with important consequences for flood forecasting and predictions in poorly monitored basins.
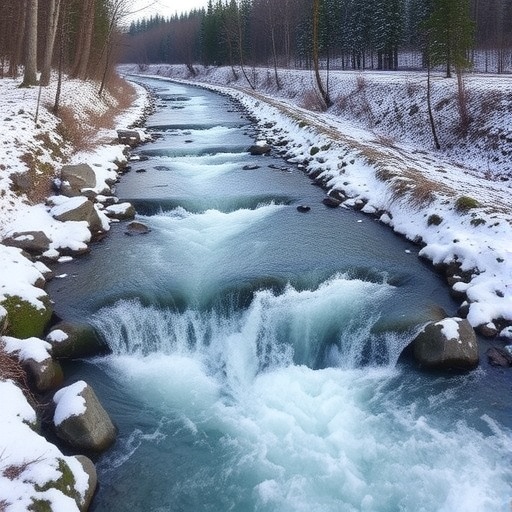
The study, published in Water Resources Management, examined the Goose River, a tributary of the Red River of the North. More than 80 percent of the watershed is agricultural, the terrain is remarkably flat, with slopes below 3 percent, and the soils contain substantial clay. Wetlands and open water account for about 10 percent of the basin, while average soil permeability is approximately 2.5 inches per hour. Those features make the watershed a challenging laboratory for prediction. Snow can accumulate during winter, frozen ground can restrict infiltration, and the arrival of spring warmth can release stored water in a sudden pulse. Rain falling on existing snow can create another rapid runoff pathway. In such systems, streamflow on any given day may depend not only on current precipitation and temperature, but also on how much water the landscape stored days or weeks earlier.
To disentangle these influences, Adewale Ajao and Yeo Howe Lim developed a six-tier diagnostic framework rather than simply comparing increasingly complex algorithms. The researchers assembled daily observations from 1 October 1999 through 30 September 2024, combining US Geological Survey discharge measurements with meteorological records, snow-related information, soil properties, elevation data and land-cover maps. They divided the watershed into 25 sub-basins and represented their relationships in digital maps. One network contained 19 directed connections describing how water moves from upstream to downstream. A second adjacency network connected sub-basins sharing boundaries, allowing the models to exchange information between neighboring areas. Every model was asked to forecast discharge for the following day, but each tier was designed to add or isolate a different kind of hydrologic information.
The first tier used only changing environmental conditions, such as meteorological inputs, and tested long short-term memory networks, a convolutional neural network combined with an LSTM, and a stacked ensemble. LSTM networks are designed to retain information across sequences, making them useful for time-dependent processes such as rainfall-runoff response. With a 30-day history of dynamic observations, these models achieved Nash–Sutcliffe efficiency scores between 0.84 and 0.87. The NSE statistic compares predictions with observations: a score of 1 represents a perfect match, while a value of 0 indicates performance no better than using the observed average. The ensemble reached 0.869 and had a bias of only 1.89 percent, demonstrating that weather alone captured much of the day-to-day variability. Yet the models consistently underestimated the size of the most extreme floods. During an April 2022 event, observed discharge reached 291.6 cubic metres per second, far above the predicted values, even though the timing of the peak was generally captured.
The second and third tiers exposed why weather is not enough. Random Forest and XGBoost models supplied only with static features—such as soil, elevation and land cover—performed poorly for short-term forecasting, producing an NSE of just 0.011 and a root-mean-square error of 21.310 cubic metres per second. Static properties describe where water tends to collect or infiltrate, but they do not reveal whether the basin is currently saturated, frozen, snow-covered or already carrying a large volume of water. Combining those landscape attributes with dynamic meteorological inputs did not solve the problem. The models in the third tier produced NSE values below 0.2, underestimated high flows and overestimated low flows; the winter split produced an NSE of –0.1409. A negative NSE means the predictions were worse than simply using the average observed discharge, underscoring how difficult cold-season runoff is to infer from current conditions and static maps alone.
The decisive improvement came when the models were given hydrologic memory: recent discharge values from the previous one, two and three days, together with forecasts generated by the weather-driven models. This fourth tier reached the strongest numerical performance, with the abstract reporting an NSE of 0.989 for the best configuration. In an additional ablation analysis designed to determine whether the apparent success was merely an effect of autocorrelation, discharge lags alone achieved an NSE of 0.937, while the meteorological prediction pathway alone reached 0.947. The complete fusion model scored 0.952 in that comparison. The result suggests that previous flow is extraordinarily informative, but it is not the whole explanation. The highest skill emerged from a nonlinear interaction between antecedent discharge, basin conditions and evolving atmospheric forcing. In hydrologic terms, yesterday’s river level acts as a compressed record of storage in soils, wetlands, snowpack and channels, while weather helps indicate how that stored water may change next.
The seasonal results gave that “memory” a physical interpretation. In winter and early spring, frozen soils limit infiltration and precipitation may remain temporarily locked in snow. When melt begins, runoff can be delayed, amplified or redistributed depending on the amount of accumulated storage. The seasonal memory models improved both the timing and magnitude of winter peaks. Summer runoff was more directly linked to rainfall, but long low-flow periods became more sensitive to evapotranspiration and declining soil moisture. The researchers also tested graph neural networks, which treat each sub-basin as a node and its hydrologic connections as edges. Unlike a conventional time-series model, a GNN can pass information through a network, allowing an upstream sub-basin’s conditions to influence predictions downstream. Graph Convolutional Networks, GraphSAGE and Graph Attention Networks all reproduced the timing of storm hydrographs, although they still underestimated extreme snowmelt peaks. During the 2022 event, GraphSAGE-based models predicted a peak near 198.87 cubic metres per second—closer to the observed event than some alternatives, but still well below 291.66.
The sixth tier combined temporal deep learning with spatial graph learning in a spatio-temporal GNN. Each sub-basin supplied a seven-day, 168-hour sequence of dynamic features, while static attributes were attached to the corresponding network nodes. The model then used graph operations to represent interactions among connected areas. Its NSE values ranged from 0.65 to 0.95 across individual sub-basins, reflecting major differences in soils, slopes, wetlands and land use. Performance was strongest during winter’s more persistent conditions and became less consistent during spring snowmelt, when runoff generation can change rapidly. Summer predictions improved as rainfall replaced snow as the dominant driver. The authors argue that this model offers a more physically consistent representation of watershed behavior than a purely autoregressive system, even though it did not achieve the very highest overall score. The distinction matters: a model that remembers yesterday’s discharge may forecast exceptionally well at a familiar gauge, while a network-aware model may provide more useful insight when conditions shift or predictions are needed at another location.
The findings do not mean that one model should replace all others. The Goose River analysis covers a single cold-region agricultural watershed, and its conclusions require testing in basins with different climates, topographies, drainage systems and land-use patterns. Daily data may also miss short-lived flood peaks and rapid snowmelt dynamics relevant to real-time warning systems. The graph structure simplifies groundwater exchanges, artificial drainage, reservoirs and flow pathways that can change with hydrologic conditions. Even so, the six-tier framework offers a practical way to distinguish genuine process information from statistical shortcuts. It could help water managers decide whether a forecasting task prioritizes raw accuracy, spatial transferability or physical interpretation. By revealing that meteorological forcing initiates much of the signal, antecedent storage drives short-term persistence and network connectivity determines how water propagates, the study points toward a new generation of hydrologic AI—systems that do not merely predict what the river will do next, but provide clues about why.
Cite Scienmag News
Violet Maxwell. (August 28, 2026). Study reveals how weather, watershed memory, and connectivity shape cold-region streamflow forecasts. Scienmag. https://scienmag.com/study-reveals-how-weather-watershed-memory-and-connectivity-shape-cold-region-streamflow-forecasts/
Violet Maxwell. "Study reveals how weather, watershed memory, and connectivity shape cold-region streamflow forecasts." Scienmag, 28 August 2026, https://scienmag.com/study-reveals-how-weather-watershed-memory-and-connectivity-shape-cold-region-streamflow-forecasts/. Accessed 3 September 2026.
Violet Maxwell. "Study reveals how weather, watershed memory, and connectivity shape cold-region streamflow forecasts." Scienmag. August 28, 2026. https://scienmag.com/study-reveals-how-weather-watershed-memory-and-connectivity-shape-cold-region-streamflow-forecasts/


