


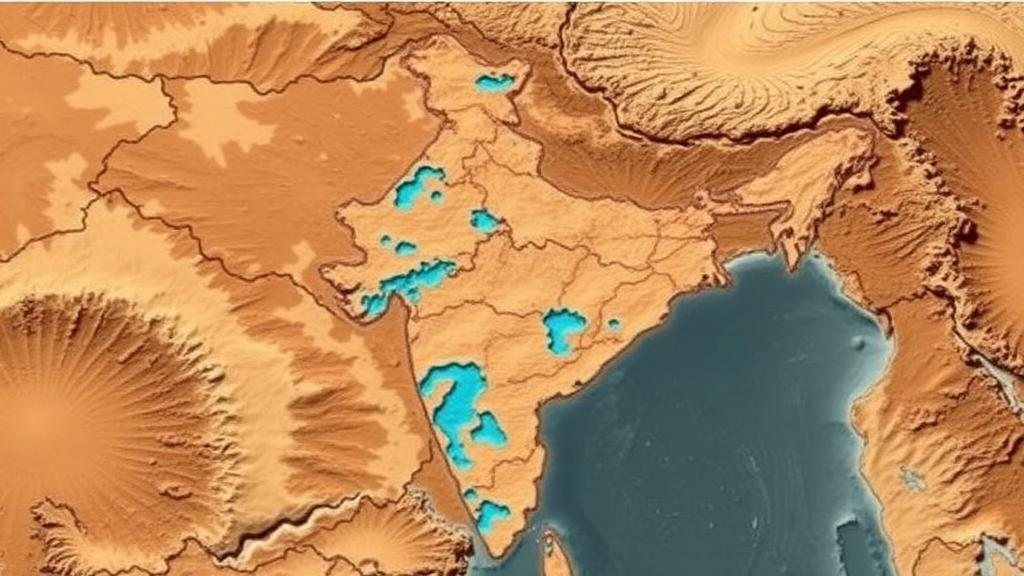
In one of India’s most water-stressed corners, a team of researchers has turned satellites, digital maps and a classic decision-making algorithm into a treasure map of a different kind: one that shows where precious groundwater is most likely to be hiding beneath the hard, granitic terrain of Mahoba district in Uttar Pradesh. The study, published in the journal Discover Geoscience, is the first of its kind for this drought-prone part of the Bundelkhand region, and it arrives at a moment when the district’s underground water reserves are under relentless pressure from a growing population, expanding agriculture and increasingly erratic monsoon rains.
Groundwater is easy to overlook precisely because it is invisible. Yet it is the invisible backbone of Indian life: nearly half of urban Indians and about ninety percent of rural households depend on it for their daily needs. Globally, groundwater accounts for roughly thirty percent of the fresh water consumed by humanity, and more than seventy percent of the water supply in some regions is drawn from underground aquifers, which are being depleted at an estimated 545 cubic kilometres per year. India, home to eighteen percent of the world’s population, holds only four percent of the planet’s renewable water resources, a mismatch that makes every new well, every irrigation schedule and every planning decision a high-stakes calculation.
Traditionally, finding good places to drill was a slow and expensive business, relying on physical field surveys and geophysical instruments deployed across large areas. The new research, led by Mukesh Kumar of United University in Prayagraj, together with Pitam Singh of Motilal Nehru National Institute of Technology and Priyamvada Singh of the University of Allahabad, replaces much of that legwork with a workflow built on geographic information systems, remote sensing and the Analytical Hierarchy Process, a structured weighting technique invented by mathematician Thomas Saaty in 1980. The result is a district-wide map that sorts the landscape into five categories of groundwater potential, from very high to very low.
The study area covers roughly 2,884 square kilometres in southwestern Uttar Pradesh, a landscape dominated by the ancient Bundelkhand Gneissic Complex and layers of Archaean and recent alluvium. In hard rock regions like this one, water does not sit in porous sandstone but in the cracks, joints and fractures that cut through the granite, which makes the search for productive wells especially challenging. Agriculture is the district’s main occupation, with wheat as a staple crop that demands heavy irrigation the rains cannot reliably provide. Seasonal rivers run thin, waterborne illness is common, and sanitation infrastructure struggles to keep pace, all of which raises the stakes of knowing exactly where the next borehole should go.
To build their model, the researchers assembled seven thematic layers that together control how water enters, moves through and is stored within the ground: lithology, geomorphology, rainfall, slope, land use and land cover, drainage density and lineament density. Each layer was constructed from publicly available data. Lithological and geomorphological information came from the Geological Survey of India at a scale of 1:250,000, while the drainage pattern was derived from the thirty-metre-resolution Shuttle Radar Topography Mission digital elevation model provided by the United States Geological Survey. Landsat 8 imagery, captured in May 2025 across four overlapping tiles, was classified using a supervised technique in ArcGIS software to produce the land use map, which revealed that barren land dominates the district.
Rainfall posed a particular challenge because the team had data from 156 individual weather stations spanning twenty years, from 1998 to 2018, supplied by the India Meteorological Department in Pune. To turn those point measurements into a continuous surface, the researchers applied Inverse Distance Weighting interpolation, a method that estimates values at unmeasured locations based on the values at surrounding stations, weighting nearer stations more heavily. The resulting map showed that the district’s largest area receives between 463 and 629 millimetres of rain annually, a modest total that makes efficient recharge and careful siting of wells all the more important. Lineament density, a measure of the fractures per unit area that act as natural conduits for water, was computed from Geological Survey of India lineament data using the line density tool in ArcGIS.
The heart of the method lies in the Analytical Hierarchy Process, which converts expert judgment into numerical weights through pairwise comparisons. Each of the seven factors was compared against every other using Saaty’s scale of importance, producing a matrix from which normalized weights were calculated. Subclasses within each layer, such as individual rock types or slope categories, were rated on a scale of one to five according to their influence on groundwater potential. Crucially, the technique includes a built-in sanity check: the consistency ratio, which measures whether the expert judgments are internally logical. The team’s matrix yielded a consistency ratio of 0.07, comfortably below the 0.10 threshold, indicating that the weighting scheme was coherent rather than arbitrary.
With weights assigned, all seven layers were converted to thirty-metre rasters in a common coordinate system and overlaid to compute a groundwater potential index for every pixel in the district. The final map tells a clear story. Moderate potential zones dominate, covering 1,837 square kilometres, or 63.7 percent of the study area, reflecting the region’s overall hard rock limitations. Very high potential zones are rare, occupying just 5.12 square kilometres, a mere 0.18 percent of the district, while low potential zones cover 10.52 square kilometres, or 0.36 percent. The best prospects cluster where rainfall is highest, slopes are gentle, drainage density is low and lineament density is high, conditions that favour infiltration and storage over rapid runoff. Conversely, the steepest, most fractured-drainage areas with the least rain scored lowest.
A model is only as good as its validation, and here the researchers overlaid their map with well discharge data from 37 wells recorded by the Central Ground Water Board in Lucknow, measured in litres per minute. The pattern was striking: high-yield wells overwhelmingly fell within the high and very high potential zones, moderate-yield wells landed in the moderate zone, and low-yield wells coincided with the low and very low zones. Overall, about eighty percent of the well discharge data agreed with the mapped categories, a figure the authors report as the model’s accuracy. They are candid about the caveats, noting that well discharge is also shaped by seasonal water table fluctuations, aquifer characteristics, well construction and pumping regimes, factors no static map can fully capture.
The implications reach well beyond one district. Because the entire workflow relies on open satellite data, freely available geological maps and a transparent weighting procedure, it can be replicated in other data-scarce regions where drilling campaigns are too expensive to deploy blindly. The authors position this map as the first scientific baseline for groundwater exploration in Mahoba, offering government agencies a rational starting point for siting wells, planning recharge structures and managing the district’s aquifers sustainably. They also outline the next step: the current output will supply training and testing points for machine learning, deep learning and ensemble techniques, which studies suggest can outperform statistical models in prediction tasks. In a region where a failed borehole can bankrupt a farming family, a map that raises the odds of striking water from guesswork to four in five is not just an academic exercise; it is a lifeline drawn in pixels.
Subject of Research: Mapping groundwater potential zones in Mahoba district, India, using GIS, remote sensing and the Analytical Hierarchy Process
Article Title: Integration of GIS, remote sensing and AHP technique for delineation of groundwater potential zones in Mahoba district Uttar Pradesh, India
Article References: Kumar, M., Singh, P., & Singh, P. (2026). Integration of GIS, remote sensing and AHP technique for delineation of groundwater potential zones in Mahoba district Uttar Pradesh, India. Discover Geoscience, 4(1), Article 346. https://doi.org/10.1007/s44288-026-00716-x
Image Credits: AI Generated
DOI: 10.1007/s44288-026-00716-x
Keywords: groundwater, GIS, remote sensing, Analytical Hierarchy Process, Mahoba district, Uttar Pradesh, Bundelkhand, water scarcity, hydrogeology, lineament density, Landsat 8, multi-criteria decision analysis
Cite Scienmag News
Violet Maxwell. (October 4, 2026). Satellites and Smart Maps Reveal Where Hidden Water Lies Beneath India’s Driest District. Scienmag. https://scienmag.com/satellites-and-smart-maps-reveal-where-hidden-water-lies-beneath-indias-driest-district/
Violet Maxwell. "Satellites and Smart Maps Reveal Where Hidden Water Lies Beneath India’s Driest District." Scienmag, 4 October 2026, https://scienmag.com/satellites-and-smart-maps-reveal-where-hidden-water-lies-beneath-indias-driest-district/. Accessed 4 October 2026.
Violet Maxwell. "Satellites and Smart Maps Reveal Where Hidden Water Lies Beneath India’s Driest District." Scienmag. October 4, 2026. https://scienmag.com/satellites-and-smart-maps-reveal-where-hidden-water-lies-beneath-indias-driest-district/


