


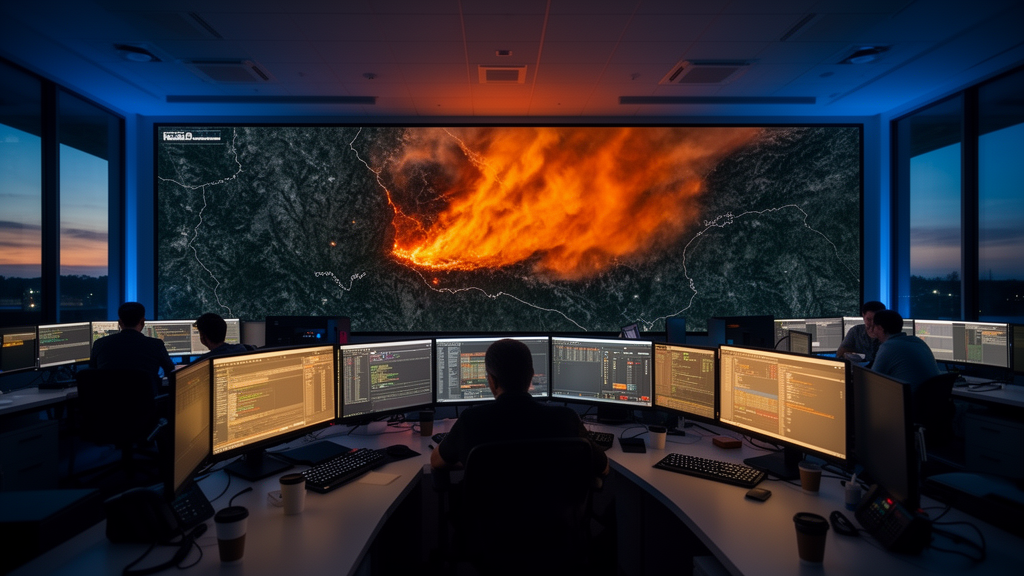
Every summer, the same question haunts climate scientists as smoke plumes stretch across continents: exactly how much carbon is the world’s burning landscape releasing into the atmosphere? For more than two decades, the Global Fire Emissions Database has been the authoritative answer, but its estimates have always arrived with a lag, sometimes years behind the fires themselves. Now a team of researchers has closed that gap. In a new study published in the journal Earth System Science Data, scientists led by investigators affiliated with NASA and several partner institutions unveiled an extension of the database that delivers fire emissions estimates in near real time, transforming a retrospective archive into a live monitoring system for the planet’s flames.
The stakes of this upgrade are considerable. Wildfires are not merely local disasters; they are a planetary carbon pump whose output fluctuates wildly from year to year. In extreme fire years, such as those that scorched Canada, Australia, and Siberia in recent memory, fires can emit carbon on a scale comparable to the annual fossil fuel emissions of major industrial economies. Yet the scientific community has often had to wait for carefully vetted datasets to catch up before quantifying those events. The new system, called the Global Fire Emissions Database near real time extension, or GFED-NRT, changes that calculus fundamentally, offering daily updates that can be compared directly against the historical record.
At its core, the system builds on the same architecture that made the original GFED the gold standard for fire emissions accounting. The approach begins with satellite observations of burned area, derived from instruments that detect the characteristic spectral signatures of freshly burned landscapes. Those observations are then combined with estimates of fuel loads, the amount of vegetation available to burn, and combustion completeness, the fraction of that fuel actually consumed by flames. Multiplying these factors together yields the mass of biomass burned, which is then converted into emissions of carbon dioxide, carbon monoxide, methane, particulate matter, and dozens of other trace gases and aerosols using standard emission factors for each vegetation type.
What makes the near real time version possible is a shift in the satellite data stream. Rather than relying on the moderate resolution burned area products that require extensive post-processing, GFED-NRT draws on the Visible Infrared Imaging Radiometer Suite, or VIIRS, aboard the Suomi NPP and NOAA-20 satellites. VIIRS provides daily global coverage with a spatial resolution fine enough to capture the patchwork of fire activity across savannas, forests, and croplands. The researchers calibrated their algorithm against the historical GFED record, ensuring that the new daily estimates are consistent with the multi-decadal archive that scientists have used for carbon budgeting, atmospheric modeling, and policy analysis.
The calibration process was far from trivial. Fire emissions depend on subtle interactions between weather, vegetation moisture, and ignition patterns, and a naive translation of satellite fire detections into emissions could introduce systematic biases. The team therefore developed a statistical framework that ingests VIIRS active fire observations and converts them into estimates of burned area and fuel consumption, using machine learning and physical relationships tuned to reproduce the historical GFED estimates as closely as possible. They validated the system against independent datasets, including burned area maps derived from Landsat imagery and atmospheric measurements of carbon monoxide from satellites, confirming that the near real time product tracks the true evolution of fire seasons with remarkable fidelity.
The payoff is already visible in the study’s analysis of recent fire years. The researchers used GFED-NRT to examine the extraordinary fire seasons of 2023 and 2024, periods that saw unprecedented burning in the boreal forests of Canada and in tropical ecosystems across South America, Africa, and Southeast Asia. The system captured the explosive onset of the Canadian fires in the spring of 2023, the relentless summer emissions that followed, and the anomalous fire activity in regions where climate change is lengthening the fire season. By placing these events in the context of the full GFED archive stretching back to 2000, the researchers could quantify just how unusual these years were, and how the frequency of extreme fire seasons appears to be increasing as the planet warms.
One of the most striking findings concerns the interplay between climate variability and fire activity. The team showed that the transition from La Niña to El Niño conditions in 2023 reshaped fire patterns across the tropics, suppressing fires in some regions while intensifying them in others. In Southeast Asia, the onset of drought conditions associated with El Niño drove a surge in peatland and forest fires, releasing not only carbon dioxide but also methane and particulate matter with serious consequences for regional air quality. In the Amazon, the combination of drought and land use pressures pushed fire emissions to levels not seen in decades. GFED-NRT tracked these shifts in real time, offering a preview of how climate oscillations translate into fire behavior on the ground.
Beyond its scientific value, the system has immediate practical applications. Fire emissions estimates feed directly into air quality forecasts, which public health agencies use to warn communities about smoke exposure. They inform carbon accounting under international climate agreements, where countries need to report emissions from land use change and fires. They support atmospheric transport models that trace the movement of smoke across hemispheres, and they underpin studies of how fire-driven aerosols affect clouds, rainfall, and radiative balance. With daily updates, these applications can now operate with a timeliness that was previously impossible, and the researchers have made the data freely available to the scientific community and the public.
The researchers are candid about the system’s limitations. Near real time estimates necessarily rely on assumptions about fuel loads and combustion that cannot be verified until more detailed post-fire assessments are complete, and the conversion of active fire detections into burned area introduces uncertainties that are larger than those in the retrospective GFED product. The team emphasizes that GFED-NRT is designed as a complement to, not a replacement for, the full GFED archive, and they plan to refine the system as new satellite data and improved vegetation maps become available. Future versions may incorporate higher resolution burned area products, better representations of peatland combustion, and more sophisticated treatment of the small fires that dominate emissions in many agricultural landscapes.
Nevertheless, the arrival of a near real time fire emissions monitor marks a turning point in humanity’s ability to understand and respond to a rapidly changing fire regime. As climate change lengthens fire seasons, dries out forests, and expands the geographic reach of burning, the need for timely, accurate, and transparent emissions data has never been greater. GFED-NRT provides exactly that, transforming a decades-long scientific effort into a living system that watches the planet burn and reports what it sees, day by day, in numbers that scientists, policymakers, and the public can trust.
Subject of Research: Near real time satellite monitoring of global wildfire emissions
Article Title: Tracking recent extremes and interannual variability of global fire emissions using a near-real-time extension to the Global Fire Emissions Database
Article References: Chen, Y., van der Werf, G. R., Mu, M., van Wees, D., Hall, J. V., Giglio, L., Vernooij, R., Morton, D. C., Xu, L., Liu, T., Scholten, R. C., Coffield, S. R., Follette-Cook, M. B., Ott, L., & Randerson, J. T. (2026). Tracking recent extremes and interannual variability of global fire emissions using a near-real-time extension to the Global Fire Emissions Database. Earth System Science Data, 18(10), 7535-7555. https://doi.org/10.5194/essd-18-7535-2026
Image Credits: AI Generated
DOI: 10.5194/essd-18-7535-2026
Keywords: wildfire emissions, GFED, satellite monitoring, carbon cycle, climate change, VIIRS, fire seasons, air quality, El Nino, boreal forests, Tracking, recent
Cite Scienmag News
Sloane Callahan. (October 15, 2026). Satellite Watchdog Now Tracks Wildfire Emissions in Near Real Time. Scienmag. https://scienmag.com/satellite-watchdog-now-tracks-wildfire-emissions-in-near-real-time/
Sloane Callahan. "Satellite Watchdog Now Tracks Wildfire Emissions in Near Real Time." Scienmag, 15 October 2026, https://scienmag.com/satellite-watchdog-now-tracks-wildfire-emissions-in-near-real-time/. Accessed 15 October 2026.
Sloane Callahan. "Satellite Watchdog Now Tracks Wildfire Emissions in Near Real Time." Scienmag. October 15, 2026. https://scienmag.com/satellite-watchdog-now-tracks-wildfire-emissions-in-near-real-time/


