The study, published in GeoEnergy Communications, combined repeated drying experiments with low-field nuclear magnetic resonance measurements to classify pore water into film water, capillary water and free water, and to quantify how each type is lost.
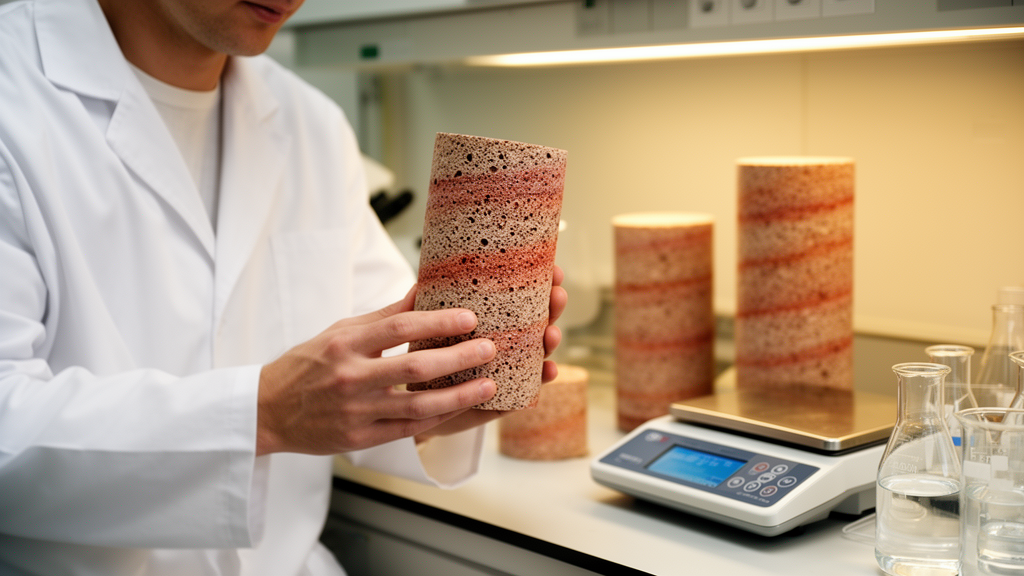
The researchers cut field-collected sandstone into cylindrical specimens 25 millimeters in diameter and 50 millimeters high, dried them at 105 degrees Celsius for 24 hours, and then saturated them under continuous negative pressure for another 24 hours. Moisture content was measured every minute, and the drying process was repeated 15 times, with each specimen wrapped in PTFE after one minute of drying, cooled to room temperature, and scanned for its nuclear magnetic resonance signal.
Low-field nuclear magnetic resonance is well suited to this task because it distinguishes fluid properties and tracks dynamic changes in pore water content and distribution. The technique records a transverse relaxation time, known as T2, for water in each pore size range, and converting those times into actual pore radii requires an accurate surface relaxation rate. To determine that rate for their sandstone, the authors ran a separate freezing experiment on a saturated sample, applying the Gibbs-Thomson relationship, which states that the freezing point of pore water drops as pore size shrinks and that a thin film of unfrozen water always persists between ice crystals and mineral grains.
During freezing, the team observed a short increase in lateral relaxation time: as the temperature fell to minus 1 degree Celsius, long relaxation time signals from free water decreased or vanished as that water turned to ice, while short relaxation time signals grew. Because the sample was sealed and could not exchange moisture with its surroundings, the researchers attributed the growing short-time signal to the unfrozen water film at the ice-rock interface. Calculating the film thickness at minus 1 degree Celsius as 117.60 nanometers, corresponding to a T2 value of 0.546 milliseconds, they derived a surface relaxation rate of 35.90 nanometers per millisecond for the sandstone. They also corrected their moisture readings for temperature using Curie’s law, since the nuclear magnetic resonance signal is inversely proportional to temperature, fitting a linear correction valid between minus 5 and 15 degrees Celsius.
With the conversion parameter fixed, the team could translate T2 spectra into pore size distributions. The saturated sandstone showed an approximately bimodal spectrum, with the first peak accounting for 89.87 percent of the total signal and the second peak 10.13 percent. As drying proceeded, both peaks declined, but at different rates: the first peak’s decay accelerated while the second peak’s decay slowed, evidence that pore water on different size scales responds very differently to drying. Water near the sample surface, with better connectivity, was expelled early, while water closer to the sample center faced greater migration difficulty and required extended drying time, a pattern consistent with Washburn’s theory of capillary processes in unsaturated media.
The bimodal structure also provided the key to classifying pore water types. After a certain number of drying cycles, the two peaks separated completely, leaving a segment of zero signal intensity between them; the minimum T2 value in that gap defined the cutoff. For the three samples, the cutoffs fell at 7.317, 6.826 and 6.826 milliseconds, occurring during the fifth, sixth and eighth drying cycles respectively. Because the spread among samples was only 0.491 milliseconds, about 7 percent of the first peak interval, the researchers adopted the mean of 7.072 milliseconds as the boundary: water with T2 above that value was classified as free water, and water below it as film water and capillary water. A three-peak structure visible after 24 hours of drying set the upper limit for film water at 0.523 milliseconds, meaning film water occupies pores with T2 below that threshold.
Tracking each water type across the 15 cycles revealed sharply different behaviors. Capillary water loss followed a downward-opening parabolic pattern, rising to a peak between the fifth and seventh cycles at roughly 10 percent of the original content before fluctuating downward between the 10th and 12th cycles. Film water loss was far more erratic, and in two of the three specimens the film water content actually increased at certain points during drying, a dispersion the authors attribute to its limited mobility and its role in chemical interactions with the rock matrix rather than in storage efficiency.
The coupling between capillary water and free water emerged as the study’s central finding. When the capillary water loss rate peaked for the three samples, at cycles 5, 6 and 7, the corresponding free water saturations were 15.14, 17.03 and 12.26 percent, averaging 14.81 percent, while capillary water saturations averaged 65.44 percent. Before that peak, the combined loss of capillary water and free water stayed essentially constant, deviating by no more than about 0.7 percent of the saturation signal level, meaning the two fractions were lost in opposite directions that offset each other. After the peak, the combined loss dropped rapidly. In absolute terms, capillary water accounted for the largest share of water lost, making it the dominant component of pore water loss in the sandstone even though film water showed the highest relative loss rate, about 43.67 percent on average, compared with 21.72 percent for capillary water and 6.34 percent for free water.
From these observations the researchers constructed a sandstone drying pore water migration model, envisioning a hierarchy in which sandstone particles are coated by film water, capillaries hold capillary water, and open macropores contain free water. Because the water film in macropores is thicker than that in capillaries, pore water pressure in the macropores exceeds that in the capillaries, so the primary early loss is free water from the macropores. When capillary water loss peaks, water within the capillaries replenishes the macropores driven by the hydraulic pressure difference, but capillary forces impose a pronounced lag on that process. Fitting the per-cycle loss rates with cubic functions, the team derived an expression for the radius of the newly emptied section of each capillary as drying proceeds, valid for the first 13 cycles, after which the fit loses accuracy.
The final step connected water loss to storage performance through the Young-Laplace equation, which relates capillary pressure to interfacial tension, contact angle and pore radius. Using an interfacial tension of 0.03 newtons per meter and a contact angle of 30 degrees, and a capillary radius of 1005.38 nanometers, the authors computed how capillary pressure changes as saturation declines. Referencing published reservoir pressure modeling that places the boundary pressure 20 kilometers from an injection point at roughly 0.11 megapascals after 10 years of injection, they used linear interpolation to find that a capillary pressure of 0.11 megapascals corresponds to a sample saturation of 45.25 percent. The authors note that in real storage operations CO2 reacts with pore water to form an acidic environment that dissolves reservoir minerals, enlarging pores and altering the capillary pressure-saturation relationship, so dynamic assessments combining this relationship with pressure-responsive monitoring can track how capillary confinement and storage efficiency evolve over time, with pressure management measures such as reduced injection, brine extraction or CO2 recovery available when pore pressure approaches safety thresholds.
Subject of Research: Pore water loss in sandstone during drying and its implications for geological CO2 storage capacity
Article Title: Experimental study on the loss of pore water in geological CO2 storage reservoirs and analysis of storage characteristics
Article References: Li, Y., Lin, J., Tu, J., Peng, S., Liu, Y., Wu, Y., & Yao, Y. (2026). Experimental study on the loss of pore water in geological CO2 storage reservoirs and analysis of storage characteristics. GeoEnergy Communications, 2(1), Article 10. https://doi.org/10.1007/s44421-026-00022-9
Image Credits: AI Generated
DOI: 10.1007/s44421-026-00022-9
Keywords: geological CO2 storage, sandstone, pore water, capillary pressure, low-field nuclear magnetic resonance, T2 spectrum, drying cycles, residual trapping, CCUS, surface relaxation rate, pore size distribution, sequestration effectiveness
Cite Scienmag News
Violet Maxwell. (October 28, 2026). Sandstone Drying Experiments Reveal How Pore Water Loss Shapes CO2 Storage Capacity. Scienmag. https://scienmag.com/sandstone-drying-experiments-reveal-how-pore-water-loss-shapes-co2-storage-capacity/
Violet Maxwell. "Sandstone Drying Experiments Reveal How Pore Water Loss Shapes CO2 Storage Capacity." Scienmag, 28 October 2026, https://scienmag.com/sandstone-drying-experiments-reveal-how-pore-water-loss-shapes-co2-storage-capacity/. Accessed 28 October 2026.
Violet Maxwell. "Sandstone Drying Experiments Reveal How Pore Water Loss Shapes CO2 Storage Capacity." Scienmag. October 28, 2026. https://scienmag.com/sandstone-drying-experiments-reveal-how-pore-water-loss-shapes-co2-storage-capacity/