


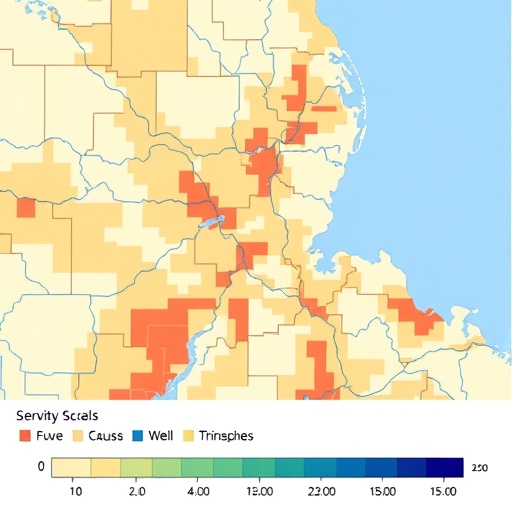
For more than a century, scientists have struggled with a deceptively simple question: how bad was that flood? Earthquakes have the Mercalli scale, tornadoes have the Fujita scale, hailstorms have the TORRO scale, all of which classify events by their observable consequences rather than by hard-to-obtain physical measurements. Floods, by contrast, have never had a widely accepted severity scale, largely because peak discharge data are often missing, incomplete, or impossible to tie to a meaningful river section. Now, a team of researchers at the Politecnico di Torino in Italy has taken a decisive step toward filling that gap, proposing a five-level impact-based classification called the FLOSEV scale, calibrated on the largest systematic archive of flood events in Europe.
The new study, published in the journal Natural Hazards, was led by Alessandro Giacalone, Anna D’Andrilli, Paola Mazzoglio and Pierluigi Claps of the Department of Environment, Land and Infrastructure Engineering. Their central insight is that a flood’s true severity, from a disaster-risk perspective, is better captured by its scars than by its hydrology. Similar rainfall amounts can produce wildly different outcomes in different environments, and regions accustomed to extreme precipitation often develop resilience that blunts the damage of even record-breaking storms. A moderate flood hitting a vulnerable, poorly protected area can be far more destructive, in human and economic terms, than a meteorological monster in a well-defended one.
To build the scale, the researchers turned to the AVI database, Aree Vulnerate Italiane, an extraordinary inventory of landslides and floods in Italy commissioned in 1989 by the Italian Department of Civil Protection and compiled by the National Research Council’s Group for the Prevention of Hydro-geological Catastrophes. The catalogue, digitized since 1999 within the SICI information system, contains 8,503 flood records spanning events from the year 1030 to 2002, but its systematic coverage really begins in the early twentieth century. Each record contains structured, text-based information about the affected municipalities, the date, the watercourses involved, hydrological data where available, and, most importantly, a rich damage section describing impacts on agriculture, public buildings, civil structures, industrial facilities, infrastructure, networks and cultural heritage, along with counts of fatalities, injured and displaced persons.
The raw archive was far from analysis-ready. The authors had to retrieve all records programmatically with a Python-based scraping pipeline, then tackle a series of inconsistencies baked into decades of compilation by different regional teams. The infamous November 4, 1966 Florence flood, for example, generated 186 separate records, most describing a single affected city, while other major events were similarly fragmented or duplicated. Applying a merging rule that unified records sharing the same date and at least one overlapping province, correcting entries with erroneous municipality counts, manually verifying every event reporting more than ten fatalities, and removing the 1985 Val di Stava tailings-dam collapse on the grounds that it was an industrial rather than a natural disaster, the team reduced the database from 8,384 usable records to 7,059 unique events. Restricting the analysis to the well-documented modern era, from 1900 onward, left 6,292 events across a 103-year period, involving 4,482 distinct Italian municipalities.
The design of the FLOSEV scale reflects both statistical reasoning and practical constraints. The researchers aimed for a quasi-logarithmic classification, in which each level contains roughly an order of magnitude fewer events than the one below, mirroring the right-skewed distribution of natural hazards where catastrophic events are exponentially rarer than moderate ones. They settled on five levels, consistent with the range of five to thirteen levels observed in established damage scales. Crucially, the classification combines quantitative variables, the number of fatalities and affected municipalities, with qualitative indicators of asset destruction, since detailed economic damage figures exist only for recent, well-studied events while the historical record is largely descriptive.
Calibration proceeded through a percentile-rank approach. For each event, three key variables, fatalities, number of affected municipalities, and the count of total-damage indicators, were each ranked independently from 0 to 1, and a composite severity score was computed as the median of the three ranks. This choice weights human impact, spatial extent and asset destruction equally without privileging any single dimension. Events are assigned to Levels 2, 3 or 4 if they exceed the thresholds for at least two of the three variables, a deliberate “2-out-of-3” rule that balances robustness against flexibility: a strict AND rule would underclassify events with patchy documentation, while a permissive OR rule would inflate the category of floods extreme in only one dimension. Level 5 is reserved for events with at least 150 fatalities, a threshold benchmarked not only against the deadliest Italian floods but also against major European catastrophes such as the 2021 Ahr Valley flood in Germany and the 2024 DANA event in Spain, so that any future disaster of that magnitude can be classified immediately without retrospective comparison.
When applied to the full twentieth-century record, the scale produced exactly the hierarchy its designers hoped for: 5,548 events in Level 1, with each successive level containing roughly a tenth as many, down to just two events at Level 5. Those two are the very worst the century could offer. The 1963 Vajont disaster, in which a massive landslide into the reservoir behind the Vajont Dam sent a catastrophic wave over the dam and obliterated the town of Longarone, killing 1,917 people, the deadliest event of the century in Italy, registered 21 indicators of total destruction. The 1954 Salerno flood, triggered by extraordinary rainfall on October 25 of that year, claimed 318 lives and destroyed or severely damaged assets across the city and five neighboring coastal towns, with 12 of its 25 damage indicators rated as total.
One level down, the 13 Level-4 events read like a litany of Italy’s most haunting floods, and include the legendary 1966 Florence inundation, which, despite its cultural notoriety and the damage to priceless artistic heritage, fell short of the mortality and destruction of the two Level-5 catastrophes. At thirteen events per century, the authors note, Level-4 floods amount to roughly a “flood of the decade,” the disasters a nation finds hard to forget. Perhaps surprisingly, the average severity level remained remarkably stable across the twentieth century, showing no significant long-term trend, and a weak positive relationship emerged between the number of recorded events and their average severity, a pattern the authors caution may reflect differences in reporting intensity and spatial coverage rather than any genuine physical link.
The real test of any scale is whether it works on fresh events, so the team applied FLOSEV to two recent Italian floods with abundant modern documentation. The first was the October 2–3, 2020 Piedmont flood caused by extratropical storm Alex, which delivered a staggering 589 millimeters of rain at the Limone Pancani station, 538 of them in just twelve hours, more than three and a half times the previous record for the area. With over 350 affected municipalities, roughly 25,000 square kilometers touched, three deaths and some 770 people temporarily displaced, the event would rank as the second most widespread in the entire database. Yet FLOSEV assigned it only Level 2: despite the exceptional rainfall and massive infrastructure damage, the modest death toll and the absence of total destruction of civil buildings kept it out of the higher tiers, a verdict the authors read as evidence of how far flood risk management and prevention have advanced since the twentieth century’s deadliest events.
The second case was the September 15–16, 2022 flood in the Marche region, produced by a stationary, self-regenerating V-shaped thunderstorm that dumped 419 millimeters of rain on Cantiano in about nine hours, with peak intensities of 90 millimeters per hour, more than 30 percent of the area’s annual precipitation. The event killed 13 people, displaced over 1,200, triggered 1,687 landslides across Marche and Umbria, destroyed bridges, and submerged the ground floors of hundreds of buildings. FLOSEV rated it Level 3, placing it among the hundred most severe floods of the past centuries, a classification the authors judge entirely reasonable given its human toll and material devastation.
The comparison with existing alternatives is instructive. The Flash Flood Impact Severity Scale of Diakakis and colleagues, a ten-level system organized around impacts on the built environment, mobile objects, the natural environment and the population, demands high-resolution evidence, such as the precise location and typology of damage to individual structures, that even the well-documented Piedmont and Marche events could not fully supply. FLOSEV, by relying only on fatalities, affected municipalities and damage extent retrievable from technical reports and newspaper archives, sacrifices some granularity but gains the ability to classify events consistently across decades and centuries, precisely where instrumental hydrological data are absent.
The researchers acknowledge limitations: impact data collection is labor-intensive, and newspaper-based archives carry biases toward larger cities and socially resonant events, likely underrepresenting remote disasters. Still, they emphasize that FLOSEV is not an Italy-specific tool but a general framework, transferable to other contexts where similar impact information exists, with potential datasets including insurance catalogs such as Munich Re’s NatCatSERVICE and the global EM-DAT database. Geographically tailored thresholds could refine the system elsewhere. What the scale ultimately offers is something flood science has long lacked: a common, intuitive language for comparing the worst floods of one era with those of another, measured not in cubic meters per second but in the enduring scars they leave behind.
Cite Scienmag News
Violet Maxwell. (September 9, 2026). Reading flood scars to build a data-driven severity scale. Scienmag. https://scienmag.com/reading-flood-scars-to-build-a-data-driven-severity-scale/
Violet Maxwell. "Reading flood scars to build a data-driven severity scale." Scienmag, 9 September 2026, https://scienmag.com/reading-flood-scars-to-build-a-data-driven-severity-scale/. Accessed 9 September 2026.
Violet Maxwell. "Reading flood scars to build a data-driven severity scale." Scienmag. September 9, 2026. https://scienmag.com/reading-flood-scars-to-build-a-data-driven-severity-scale/


