


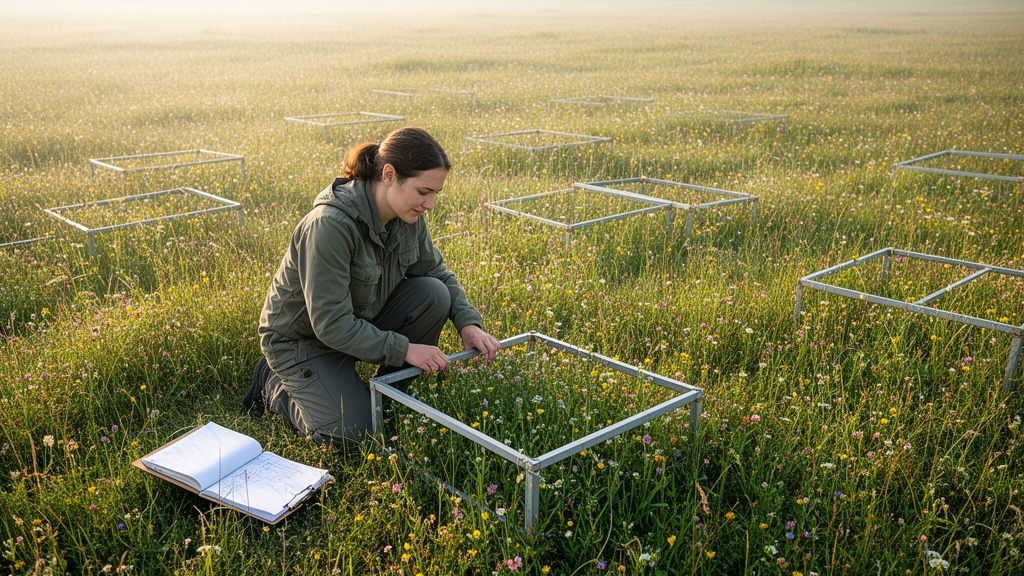
In vegetation ecology, few methodological choices are as consequential as how researchers record the cover of each plant species in a plot. A new study published in Vegetation Classification and Survey shows that the widespread habit of estimating cover on ordinal scales instead of direct percentages can systematically distort some of the most widely used biodiversity indices, and can even scramble the ranking of communities by their diversity. The findings, based on three empirical datasets from contrasting European habitats, suggest that many comparative studies of plant diversity may rest on a shaky numerical foundation.
Plant cover assessment is a central step in vegetation ecology, phytosociology and habitat monitoring. Although percent cover is regarded as the relevant measure, most researchers do not note percent values directly. Instead, they use one of the many ordinal cover-abundance scales, of which the Braun-Blanquet scale in its numerous variants is by far the most popular. According to a review of sPlot, currently the most comprehensive vegetation-plot database on Earth, 66 percent of all plots were recorded with a Braun-Blanquet-type scale, only 15 percent with direct percent cover, and 19 percent with one of 55 other numeric or ordinal measures. The new study, conducted by Jürgen Dengler and Iwona Dembicz, asks whether this common practice biases the diversity metrics derived from vegetation plots and whether a different back-translation of ordinal categories could improve the situation.
The work builds on the authors’ earlier simulation study, which showed that the double transformation involved in using an ordinal scale leads to an error inflation. In that study, using a 7-step variant of the Braun-Blanquet scale under the scenario the authors deemed most realistic, the original field estimation error was almost doubled by the time it entered numerical analyses. Because the authors find direct percent estimation equally or less time consuming than careful ordinal estimation, they argued against ordinal scales whenever subsequent analyses are to be based on cover values. What remained open was how large the resulting biases would be in concrete types of analyses, and species diversity was the obvious candidate, since it is nearly always analysed when vegetation plots are sampled.
Among the multitude of diversity metrics, the most widely used are species richness, Shannon diversity, Shannon evenness and Simpson diversity. Species richness is evidently independent of the cover estimation method, but the other three metrics depend on the fractional cover of each species. Dengler and Dembicz had argued that Shannon diversity and Shannon evenness are likely to be particularly biased when an ordinal scale is applied, because both use the natural logarithm of the fractional cover. Once the logarithm enters the formula, it becomes relevant whether a species had 0.1 percent or 0.001 percent cover, a distinction that all ordinal scales erase. The surveyors in the new study had estimated covers in percent as precisely as possible, with values down to 0.001 percent, corresponding to one square centimetre in ten square metres.
To answer their questions, the researchers selected three datasets from different habitats and regions where plant cover had been estimated directly in percent. Dataset A comprised 32 plots of 100 square metres from the subalpine and alpine belt around Preda in the Swiss canton of Grisons, covering forests, grasslands, tall forb communities, heathlands, snow beds and screes, with a mean species richness of 45.7 vascular plant species per plot. Dataset B contained 171 plots of 10 square metres from the inneralpine dry valleys of Switzerland, representing dry grasslands with a mean richness of 35.3 terricolous taxa. Dataset C consisted of 60 plots of 10 square metres from semi-natural grasslands on the Swedish island of Gotland, ranging from dry to wet, with a mean richness of 34.5. The original percent covers were then translated into the ordinal values of the 13-step Londo scale, the 7-step Braun-Blanquet scale and the 5-step Hult-Sernander-Du Rietz scale, three widely used scales that together represent the wide variety of existing ordinal systems.
Subsequently, the ordinal categories were back-translated to percent cover, first according to prevailing practice, which uses the arithmetic mean of the cover class borders, and second using the geometric mean as an alternative and generally applicable solution. The idea of geometric means is inspired by the fact that species-cover distributions normally contain more species with lower than with higher cover. For each plot, three alpha diversity metrics were calculated with the R package vegan: Shannon diversity, defined as the negative sum of the products of fractional cover and its natural logarithm; Shannon evenness, which divides Shannon diversity by the logarithm of species richness; and Simpson diversity, the Gini-Simpson index calculated as one minus the sum of squared fractional covers. The metrics based on the original percent values were compared with those based on the double-transformed values using paired Welch t-tests with Bonferroni correction, and the biodiversity ranking of plots was compared by calculating absolute rank changes.
The results revealed a clear pattern of systematic bias. The traditional replacement with arithmetic class mid-points led to a consistent overestimation of all three biodiversity metrics, statistically significant in 22 out of 27 combinations of dataset and metric, while the geometric mid-points led to a consistent underestimation, significant in 23 out of 27 combinations. On average, the overestimation was larger than the underestimation. The 5-step Hult-Sernander-Du Rietz scale showed by far the most severe biases: Shannon diversity was on average 0.96 too high with arithmetic back-translation and 0.67 too low with geometric back-translation. The Londo scale produced moderate arithmetic biases, while the Braun-Blanquet scale, in both back-translations, and the Londo scale with geometric means showed only small and partly significant biases. Among the three metrics, Shannon diversity was most negatively affected and Simpson diversity least.
The explanation lies in the typical structure of species-abundance distributions. As Preston highlighted as early as 1948, biological samples almost always contain more rare than frequent species, with abundances approximately following a log-normal curve whose left-most part is cut off in limited samples. When ordinal categories are back-translated to arithmetic class mid-points, more species receive higher covers than they actually had. The Braun-Blanquet category 2, ranging from 5 to 25 percent cover, is replaced by 15 percent, yet usually more species fall between 5 and 15 percent than between 15 and 25 percent. This effectively increases the calculated diversity. Interestingly, the coarser Braun-Blanquet scale performed similarly to or even better than the finer Londo scale, contrary to the authors’ initial expectation that bias would scale with the number of steps. The decisive factor is not the overall number of categories but the resolution at the lower cover values where most species are recorded. The Braun-Blanquet variant used has two steps below 1 percent cover, while the Londo scale does not differentiate below 1 percent. The Hult-Sernander-Du Rietz scale combines all cover values up to 6.25 percent in its first category, replacing them with 3.125 percent, which strongly inflates diversity and necessarily raises evenness.
Perhaps the most concerning finding concerns the biodiversity ranking of communities. Applying an ordinal transformation affected the diversity rank of a plot in most cases, with patterns highly consistent across the three datasets and both back-translation approaches. Even in the least affected combination, Simpson diversity with the Braun-Blanquet scale and geometric back-translation, the most affected plot in a standardized 100-plot sample would change its ranking by 18 positions. In the most affected combination, Shannon evenness with the Hult-Sernander-Du Rietz scale and arithmetic back-translation, plots on average would change their rank by 22.8 positions and in the extreme case by 79 positions. This means that a plot rated among the most diverse based on field cover estimates could be rated among the least diverse after ordinal transformation, or vice versa. Since biodiversity metrics are typically used to compare communities in their relative positions to each other, the authors conclude that no ordinal scale should be used for sampling in such cases. It does not help if the overall mean across a large dataset remains unchanged, if this results from similar numbers of plots showing strong increases and strong decreases.
The authors offer clear recommendations. If comparisons of biodiversity metrics other than species richness are planned, ordinal scales should be avoided in field sampling and direct percent values should be estimated instead. For large vegetation plot databases such as the European Vegetation Archive, sPlot or GrassPlot, it would be beneficial to store and provide the original scale used in the field in addition to harmonised percentage covers, allowing users to account for possible distorting effects, for example by filtering for plots sampled with percent cover. Regarding legacy data recorded on ordinal scales, the analyses did not yield a clear prevalence of arithmetic or geometric back-translation, so the authors recommend more comprehensive studies with a variety of back-translation approaches, using datasets with known percent cover values, to establish for each ordinal scale the best general back-translation. Until then, the message for field ecologists is simple: estimate in percent, and the diversity of your communities will speak for itself.
Subject of Research: Should we estimate plant cover in percent or on ordinal scales? II – Diversity indices
Article Title: Should we estimate plant cover in percent or on ordinal scales? II – Diversity indices
Article References: Dembicz, I., & Dengler, J. (2025). Should we estimate plant cover in percent or on ordinal scales? II – Diversity indices. Vegetation Classification and Survey, 6, 133-140. https://doi.org/10.3897/vcs.144252
Image Credits: AI Generated
DOI: 10.3897/VCS.144252
Keywords: Should, estimate, plant, cover, percent, ordinal, scales, Diversity, indices, scientific research
Cite Scienmag News
Gavin Prescott. (October 17, 2026). Percent Cover Estimates Beat Ordinal Scales for Reliable Plant Diversity Rankings. Scienmag. https://scienmag.com/percent-cover-estimates-beat-ordinal-scales-for-reliable-plant-diversity-rankings/
Gavin Prescott. "Percent Cover Estimates Beat Ordinal Scales for Reliable Plant Diversity Rankings." Scienmag, 17 October 2026, https://scienmag.com/percent-cover-estimates-beat-ordinal-scales-for-reliable-plant-diversity-rankings/. Accessed 17 October 2026.
Gavin Prescott. "Percent Cover Estimates Beat Ordinal Scales for Reliable Plant Diversity Rankings." Scienmag. October 17, 2026. https://scienmag.com/percent-cover-estimates-beat-ordinal-scales-for-reliable-plant-diversity-rankings/


