


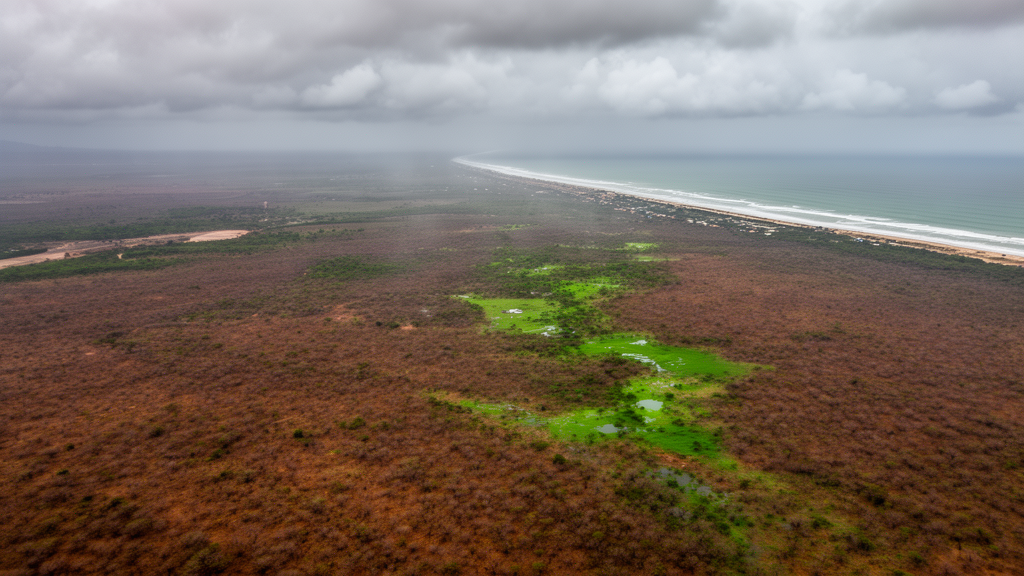
Climate models project that precipitation-based meteorological drought across Northeast Brazil will not simply arrive more often: individual negative annual sequences are expected to begin less frequently, persist longer and accumulate deeper precipitation deficits, but the response varies substantially among locations and simulations. A regional analysis of 82 hydrographic microregions finds that annual precipitation conditions shift downward under both major greenhouse-gas scenarios, with the stronger change under SSP5-8.5. In that pathway, the median frequency of moderately dry years reaches 32.0%, compared with 26.5% under SSP2-4.5 and 16.1% in the observed record. The projection therefore indicates a reorganization of precipitation drought, not a spatially uniform rise in the frequency of independent dry episodes.
The study combines daily precipitation observations for 1961–2022 with 25 retained CMIP6 model-variant simulations for 2015–2100. Its 0.1-degree observational dataset was interpolated from 11,473 rain gauges and 1,252 weather stations, then averaged within the boundaries of Brazil’s 82 official hydrographic microregions. Model precipitation was bias-corrected with multiplicative quantile delta mapping, using a fixed 1961–2014 reference period for calibration and for the principal SPI distributions. An independent test recalibrated the correction for 1961–1990 and evaluated it over 1991–2014, checking whether it improved precipitation and drought-related properties outside the calibration period. Because each source ID–variant combination received equal weight, the ensemble summaries describe the available models but are not independence-adjusted probabilities, and one realization per simulation prevents internal climate variability from being separated from inter-model spread.
Drought was measured with the 12-month Standardized Precipitation Index, or SPI-12, which transforms accumulated precipitation into a standardized measure of wetness and dryness. The analysis used the December value each year to represent approximately January–December precipitation. A negative-SPI-12 event was defined as consecutive years with values below zero; its duration was the number of years, its severity the absolute cumulative SPI deficit and its intensity the severity divided by duration. This definition captures prolonged sequences of mildly negative annual anomalies as well as sharply dry years. It also identifies an extreme-peak event as a negative sequence that reaches an annual SPI-12 value of −2.0 or lower. As a precipitation-only measure, SPI-12 does not capture temperature-driven evaporative demand, river flow, reservoir storage, groundwater recharge or socioeconomic impacts.
The projected distribution of annual SPI-12 was lower across most microregions under both emissions pathways. The median of model-specific temporal medians was −0.324 under SSP2-4.5 and −0.526 under SSP5-8.5. When each microregion was compared with its own observed median, the median local change was −0.305 SPI units under SSP2-4.5 and −0.449 under SSP5-8.5. The ensemble-median frequency of years with SPI-12 at or below −1 exceeded the observed frequency in 79 of 82 microregions under SSP2-4.5 and in all 82 under SSP5-8.5. Models nevertheless differed substantially: some produced more negative median SPI-12 values, while others remained closer to zero or slightly positive in certain locations. The regional result therefore describes a common distributional shift accompanied by substantial spatial and inter-model variation rather than an identical trajectory across Northeast Brazil.
Trend analysis showed broad agreement on the direction of change but much less evidence for a consistent linear decline at every location. For 2015–2100, the median proportion of simulations producing negative Sen slopes was 74.0% under SSP2-4.5 and 84.0% under SSP5-8.5. At least three-quarters of simulations agreed on drying in 41 and 58 microregions, respectively. Far fewer results remained statistically supported after a false-discovery-rate correction: the median fraction combining a negative slope with an adjusted p-value below 0.05 was 8.0% under SSP2-4.5 and 36.0% under SSP5-8.5. The horizon analysis also showed that the signal was not a simple progression. Under SSP2-4.5, the ensemble-median Sen slope was approximately zero in 2063–2100, whereas it remained negative in both horizons under SSP5-8.5, although its magnitude and agreement did not increase monotonically. These results distinguish a downward shift in annual dryness from widespread FDR-supported local monotonic trends.
Area-weighted results showed that drought conditions would coincide across larger portions of Northeast Brazil in more years, although severe and extreme coverage would remain less widespread than moderate coverage. In the second half of the century, mean ensemble-median coverage rose from 18.6% during 2015–2057 to 23.9% under SSP2-4.5 for SPI-12 at or below −1.0. Under SSP5-8.5, it increased from 21.0% to 34.3%. Severe coverage under SPI-12 at or below −1.5 reached 18.3% in the late-century SSP5-8.5 average, while extreme coverage under SPI-12 at or below −2.0 rose to 8.4%. During 2058–2100 under SSP5-8.5, 79% of years had at least 25% of the region under moderate drought according to the ensemble median, 28% exceeded 40% coverage, and severe coverage reached or exceeded 25% in 16% of years. Even in that late-century high-emissions case, moderate-drought coverage remained below 25% in about 16% of years, highlighting strong year-to-year and inter-model variability.
Local event sequences added detail to the projected changes in annual coverage. The median annual onset rate of all negative-SPI-12 events declined under every scenario and horizon, reaching a change of −0.064 events per year in the far future under SSP5-8.5. At the same time, median event duration increased by 1.0 year in most future conditions and by 1.5 years in the far future under SSP5-8.5. The proportion of microregions whose typical event lasted at least two years rose from 27% in the observations to between 89% and 96% across the four future cases. Median severity increased by 0.86 to 2.18 SPI-deficit units, while median intensity rose by 0.18 to 0.46 deficit units per year. The modeled increase in cumulative severity therefore reflected both longer continuity of negative annual conditions and greater average deficits within those sequences; it was not an estimate of hydrological or water-supply shortages.
Extreme annual conditions within those sequences were projected to become more common even as the onset rate of new negative-SPI-12 sequences declined. The median change in the annual onset rate of events reaching SPI-12 of −2.0 or lower was positive in all four scenario–horizon combinations. It ranged from 0.018 to 0.020 new extreme-peak events per year under SSP2-4.5 and from 0.018 to 0.034 under SSP5-8.5. Projected rates exceeded observed rates in 70 to 80 of the 82 microregions, depending on the scenario and horizon. Agreement was strongest under late-century SSP5-8.5, when at least 75% of simulations projected an increase in 51 microregions, although changes were generally smaller and less consistent in central areas. Together, the onset and sequence results indicate fewer interruptions of below-reference annual precipitation conditions, more persistent negative runs and more frequent extreme annual values within those runs.
A bivariate copula analysis tested the recurrence of events comparable to each microregion’s most severe observed event overlapping the 2012–2018 regional drought. One criterion required an event to equal or exceed both the reference duration and cumulative severity; another required it to equal or exceed either one. Under the stricter “both” criterion, the median projected-to-historical return-period ratio was 1.03 under SSP2-4.5 but 0.65 under SSP5-8.5, corresponding to a median return period about 35% shorter in the higher-emissions case. Under the “either” criterion, the median ratios were 0.75 and 0.60, respectively. Ratios below one occurred in 59 of 82 microregions under SSP2-4.5 and 63 under SSP5-8.5 for the inclusive criterion. Uncertainty remained substantial: the 95% bootstrap interval included one in 38 and 27 microregions for the “either” criterion under SSP2-4.5 and SSP5-8.5, and in 23 and 34 microregions for the “both” criterion. The inclusive results therefore gave the more extensive evidence of shorter return periods, while the stricter results retained greater spatial heterogeneity.
The findings provide a spatial basis for prioritizing local water-security assessment, but they are not direct forecasts of reservoir deficits, crop losses, hydrological drought or water-supply shortages. SPI-12 isolates precipitation-based meteorological drought and excludes temperature-driven evaporative demand, streamflow, soil moisture, groundwater, water use and social vulnerability. The comparison also uses different historical and projected catalogues rather than paired year-by-year realizations, and a univariate bias-correction method cannot guarantee that event persistence or duration–severity dependence is reproduced without bias. The projected return periods are conditional on each local reference event, selected copula family and catalogue-specific event rate, while bootstrap intervals exclude uncertainty in copula-family selection and event frequency. The central finding is therefore a heterogeneous, scenario-dependent shift toward more persistent and severe precipitation deficits, with more frequent extreme annual conditions and stronger evidence under SSP5-8.5, but limited FDR-supported local trend detection and no uniform region-wide trajectory of increasingly frequent independent droughts.
Subject of Research: CMIP6 projections of precipitation-based meteorological drought across Northeast Brazil
Article Title: Past-to-future drought across hydrographic microregions in Northeast Brazil: SPI-based diagnostics and bivariate (duration–severity) risk under CMIP6 scenarios
Article References: Rolim, L. Z. R., de Assis de Souza Filho, F., & Estácio, Á. B. S. (2026). Past-to-future drought across hydrographic microregions in Northeast Brazil: SPI-based diagnostics and bivariate (duration–severity) risk under CMIP6 scenarios. Natural Hazards, 122(22), Article 694. https://doi.org/10.1007/s11069-026-08433-x
Image Credits: AI Generated
DOI: 10.1007/s11069-026-08433-x
Keywords: Northeast Brazil, precipitation drought, CMIP6, SPI-12, drought duration, drought severity, return periods, copula analysis, hydrographic microregions, climate projections, Past-to-future, drought
Cite Scienmag News
Courtney Benton. (October 22, 2026). Northeast Brazil precipitation drought projections show heterogeneity and limited local trends. Scienmag. https://scienmag.com/northeast-brazil-precipitation-drought-projections-show-heterogeneity-and-limited-local-trends/
Courtney Benton. "Northeast Brazil precipitation drought projections show heterogeneity and limited local trends." Scienmag, 22 October 2026, https://scienmag.com/northeast-brazil-precipitation-drought-projections-show-heterogeneity-and-limited-local-trends/. Accessed 22 October 2026.
Courtney Benton. "Northeast Brazil precipitation drought projections show heterogeneity and limited local trends." Scienmag. October 22, 2026. https://scienmag.com/northeast-brazil-precipitation-drought-projections-show-heterogeneity-and-limited-local-trends/


