


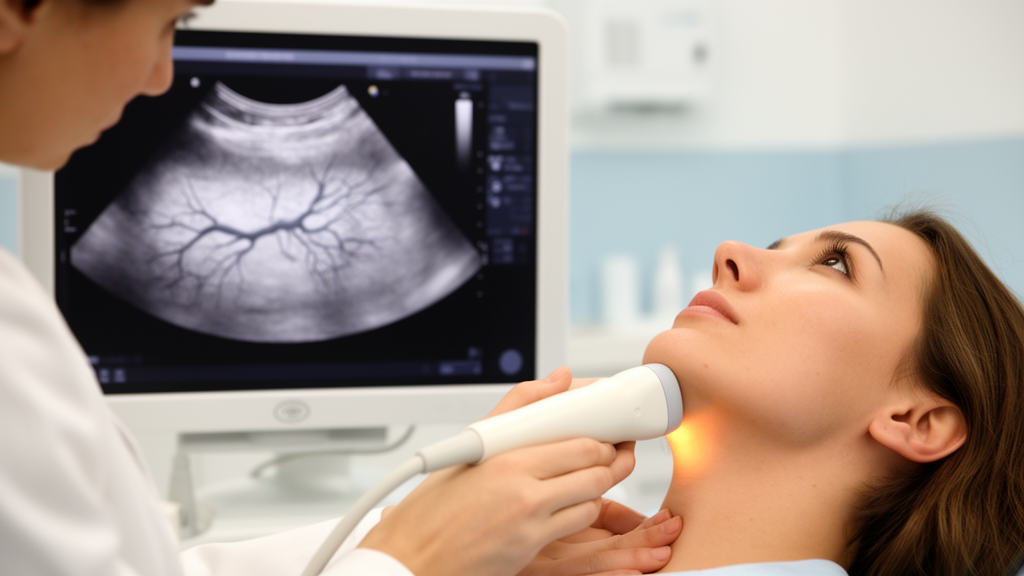
An advanced ultrasound technique that visualizes the thyroid’s smallest blood vessels has shown striking ability to distinguish between the two most common autoimmune thyroid diseases, according to a prospective study published in Frontiers in Endocrinology. Researchers in Timisoara, Romania, report that subtraction Ultra-Micro Angiography, or sUMA, produced a stepwise rise in a quantitative vascularity index across healthy controls, patients with chronic autoimmune thyroiditis, and patients with Graves’ disease, and that the index retained high discriminatory performance during internal validation. The authors stress that the proposed numerical thresholds remain exploratory and must be confirmed in larger, multicenter cohorts before any clinical use.
The study enrolled 179 participants at a specialized endocrine ultrasonography center over an 18-month period from October 2024 to March 2026: 84 healthy controls, 74 patients with newly diagnosed, untreated chronic autoimmune thyroiditis (CAT), and 21 patients with newly diagnosed, untreated Graves’ disease (GD). Controls had normal thyroid ultrasound findings, thyroid-stimulating hormone within the reference range, no history of thyroid disease, and negative thyroid autoantibodies. CAT was defined by elevated TSH with evidence of autoimmunity through anti-thyroid peroxidase or anti-thyroglobulin antibodies, while GD required suppressed TSH, elevated free thyroid hormones, and positive thyroid-stimulating immunoglobulins. Anyone with thyroid nodules, prior surgery or irradiation, previous thyroid treatment, or incomplete data was excluded, so the cohort captured disease in its untreated, first-presentation state.
The technology behind the measurement addresses a long-standing weakness of conventional Doppler ultrasound. Color Doppler, the standard method for judging thyroid vascularity, is susceptible to motion clutter: the detected signal can originate not only from blood moving through vessels but also from subtle movement of surrounding tissue. Conventional wall filters that suppress this clutter often remove true low-velocity signals from small-caliber vessels as well, and interpretation of Doppler patterns remains partly subjective. Ultra-Micro Angiography uses plane-wave and divergent-wave transmissions combined with an advanced wall-filtering and tissue-rejection algorithm that separates genuine microvascular flow from adjacent tissue motion, substantially improving sensitivity for minute vessels with slow flow.
Of the three UMA modes, the researchers chose subtraction UMA, which sacrifices directional information to maximize sensitivity for very low-velocity flow. The key output was the color pixel percentage (CPP) index: the proportion of color-coded pixels corresponding to Doppler-detectable blood-flow signals within a defined region of interest, giving a numerical, percentage-based estimate of vascular signal density at the tissue level. All scans were performed on a single Mindray Resona R9 platform with a 3–13 MHz linear transducer operated at 11 MHz, with gain fixed at 40 and the wall filter at 46 Hz. After B-mode imaging excluded nodular disease, the operator, blinded to the laboratory-based diagnosis, activated sUMA over the central, thickest portion of each lobe and placed a small rectangular region of interest, roughly 0.8–1.0 by 1.5–2.0 centimeters, entirely within the parenchyma, excluding the poles, major arteries, and surrounding tissues.
Three CPP measurements were taken per lobe during the same session, with the region repositioned for each acquisition. Because a paired comparison showed no significant difference between the right and left lobes in any group, the mean of the two lobe medians served as the whole-gland value. The results formed a clear ladder: controls averaged 23.25 ± 6.02 percent, CAT patients 50.49 ± 13.58 percent, and GD patients 79.90 ± 8.86 percent, with differences highly significant overall. Overlap was limited between the upper control range and lower CAT range and between the highest CAT and lowest GD values, while no overlap at all was observed between controls and GD in this cohort.
The index also tracked disease activity within each condition. Among CAT patients, mean CPP sUMA was significantly higher in those with overt hypothyroidism than in those with subclinical disease, 60.26 ± 10.65 percent versus 44.20 ± 11.41 percent. After correction for multiple testing, CPP sUMA correlated positively with TSH (a Spearman coefficient of 0.84) and thyroid volume (0.59) and inversely with free thyroxine (−0.65) in CAT, with no significant links to age, sex, antibody levels, or body mass index. In GD, the index correlated positively with free triiodothyronine (0.61), free thyroxine (0.59), and thyroid-stimulating immunoglobulin levels (0.80), and inversely with BMI. The authors interpret these patterns as consistent with known biology: in early untreated CAT, elevated TSH and autoimmune inflammation may drive proangiogenic signaling and microvascular proliferation, whereas in GD, stimulatory antibodies against the TSH receptor sustain hyperfunction, gland enlargement, and marked hypervascularity. They emphasize these are associations that do not establish causality, since angiogenic mediators and tissue-level vascular remodeling were not directly assessed.
The group differences survived statistical adjustment. In multivariable linear regression controlling for age, sex, and BMI, CPP sUMA was 26.33 percentage points higher in CAT than in controls, 54.17 points higher in GD than in controls, and 27.84 points higher in GD than in CAT. When thyroid volume was added, the gaps narrowed but remained significant at 23.71, 46.84, and 23.13 percentage points respectively, and the model’s adjusted R-squared rose from 0.805 to 0.826. BMI was negatively associated with the index across groups, a pattern the authors attribute partly to a technical effect: greater adipose tissue increases examination depth and beam attenuation, reducing the sensitivity for detecting low-velocity microvascular signals. They argue BMI should therefore be considered in future validation studies and possibly built into standardized acquisition protocols.
Diagnostic performance was assessed with receiver operating characteristic analysis, with cut-offs chosen by the Youden index and uncertainty quantified through 2,000 stratified bootstrap resamples. For separating CAT from controls, the area under the curve was 0.980 (95 percent confidence interval 0.963–0.992); a cut-off above 31.55 percent yielded 93.2 percent sensitivity, 90.5 percent specificity, and 91.8 percent accuracy. For GD versus CAT, the AUC was 0.966, and a cut-off above 62.00 percent gave 100 percent sensitivity but 78.4 percent specificity. GD and controls were completely separated, with an AUC of 1.0 at a cut-off above 37.62 percent. Because these apparent figures come from the same dataset used to derive the thresholds, the team also ran 1,000 repetitions of stratified five-fold cross-validation, deriving cut-offs in training sets and applying them to held-out data. Mean accuracy held at 88.5 percent for CAT versus controls, 82.0 percent for GD versus CAT, and 98.9 percent for GD versus controls, providing a more conservative estimate that still points to substantial discriminatory power.
An exploratory repeatability analysis found moderate-to-excellent within-session agreement, with intraclass correlation coefficients ranging from 0.748 to 0.923 and within-subject coefficients of variation from 4.1 to 13.7 percent. Agreement was highest in the CAT group, while variability was lowest in GD, possibly because that disease’s intense, diffuse hypervascularity produces a more uniform signal that is less sensitive to small shifts in region-of-interest placement. Because each measurement came from a freshly acquired image with a repositioned region, these figures reflect the combined repeatability of acquisition and placement, and the authors note that between-session and interobserver reproducibility remain untested.
The limitations are considerable and the authors lay them out candidly. This was a single-center study with one experienced operator, one ultrasound platform, and fixed acquisition settings, making the proposed cut-offs machine-specific and not directly transferable to other systems without calibration and external validation. The GD group contained only 21 patients, all with overt untreated hyperthyroidism and just one man, so the apparent 100 percent sensitivity and complete separation from controls likely represent an ideal case. The CAT group excluded advanced atrophic thyroiditis, and no patient was on levothyroxine or antithyroid medication, so the values may not apply to treated, mild, or atypical disease. Thyroid function tests and antibody assays remain the primary basis for diagnosing CAT and GD, and the researchers position CPP sUMA strictly as a complementary, hypothesis-generating parameter, one that could offer rapid quantitative information when laboratory results are pending or equivocal or when scintigraphy is unavailable. Future work, they conclude, should pursue multicenter external validation across different platforms, formal reproducibility studies, and longitudinal follow-up of treated patients to determine how the index behaves over the course of therapy.
Subject of Research: Quantitative microvascular ultrasound imaging for differentiating autoimmune diffuse thyroid disease
Article Title: Microvascular imaging in diffuse thyroid disease: diagnostic performance of subtraction ultra-micro angiography
Article References: Bunceanu, S., Bena, A., Neagoe, O. C., Pui, R., Streinu, D. R., Marian, M., & Stoian, D. (2026). Microvascular imaging in diffuse thyroid disease: diagnostic performance of subtraction ultra-micro angiography. Frontiers in Endocrinology, 17, 1892757. https://doi.org/10.3389/fendo.2026.1892757
Image Credits: AI Generated
DOI: 10.3389/fendo.2026.1892757
Keywords: thyroid, ultrasound, Graves' disease, autoimmune thyroiditis, microvascular imaging, Doppler, color pixel percentage, diagnostic accuracy, ROC analysis, cross-validation, endocrinology, medical imaging
Cite Scienmag News
Ophelia Keating. (October 27, 2026). New ultrasound technique quantifies thyroid microvessels to separate Graves’ disease from thyroiditis. Scienmag. https://scienmag.com/new-ultrasound-technique-quantifies-thyroid-microvessels-to-separate-graves-disease-from-thyroiditis/
Ophelia Keating. "New ultrasound technique quantifies thyroid microvessels to separate Graves’ disease from thyroiditis." Scienmag, 27 October 2026, https://scienmag.com/new-ultrasound-technique-quantifies-thyroid-microvessels-to-separate-graves-disease-from-thyroiditis/. Accessed 27 October 2026.
Ophelia Keating. "New ultrasound technique quantifies thyroid microvessels to separate Graves’ disease from thyroiditis." Scienmag. October 27, 2026. https://scienmag.com/new-ultrasound-technique-quantifies-thyroid-microvessels-to-separate-graves-disease-from-thyroiditis/


