


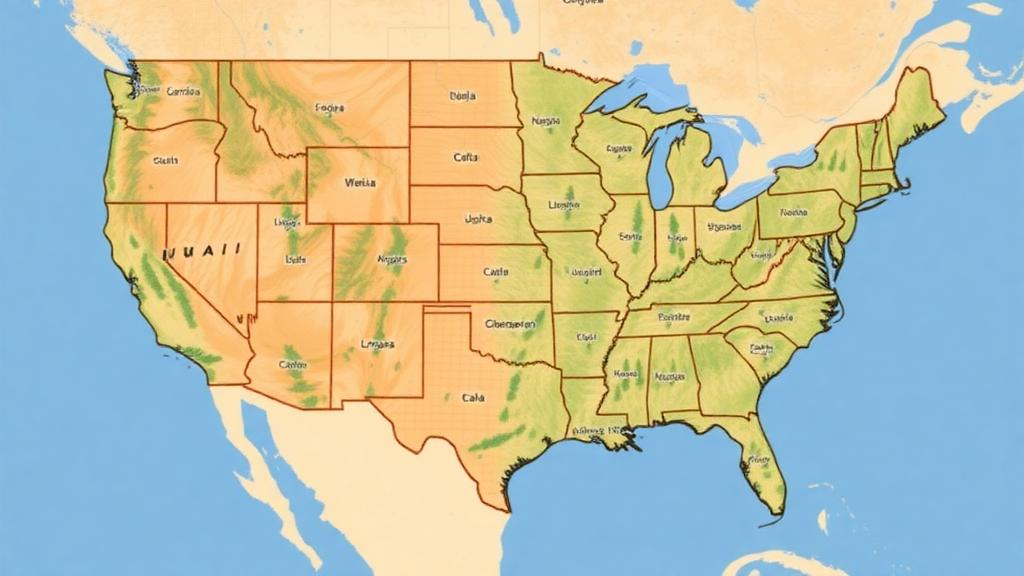
Every forest in the contiguous United States can now be described tree by tree, at least in silico. A team of researchers led by Karin Riley of the US Forest Service’s Missoula Fire Sciences Laboratory has released TreeMap 2020, 2022, and 2023, a trio of updated datasets that provide a spatially continuous, 30-meter-resolution model of forest structure and composition across the conterminous United States. The datasets, described in a preprint under review for the journal Earth System Science Data, represent a substantial refinement of a modeling framework that has quietly become one of the workhorses of American forest science, underpinning analyses of carbon storage, wildfire behavior, and wildlife habitat from coast to coast.
The central challenge TreeMap addresses is a familiar one in the geosciences: the mismatch between what we can measure and what we need to know. The Forest Inventory and Analysis program, or FIA, maintains one of the most rigorous forest monitoring systems in the world, with field crews measuring trees on a systematic grid of plots across the country. Those plots are extraordinarily informative, but they are also sparse, typically covering only a tiny fraction of the landscape. Anyone who wants to know the biomass, species composition, or size structure of a forest on a specific hillside, a proposed fuel treatment area, or a fire perimeter must somehow bridge the gap between scattered field measurements and continuous spatial coverage.
TreeMap bridges that gap through a statistical technique called imputation. Using a random forests approach, the model assigns to every forested pixel in the gridded LANDFIRE data the single FIA plot that most closely resembles it, based on a suite of predictor variables describing vegetation, topography, biophysical conditions, and disturbance history. Because each pixel inherits the full tree-level detail of its matched FIA plot, including species identities, diameters, heights, and counts of individual trees, the resulting national map carries a granularity that no direct remote sensing product can currently provide. A pixel is no longer just a green value in a satellite image; it is a stand-in for a real, measured plot of forest with all its ecological texture intact.
The new releases bring three significant methodological upgrades. The first concerns climate. Earlier versions of TreeMap relied on the biophysical variables embedded in LANDFIRE, the national landscape fire and resource management mapping program, to characterize the growing conditions at each pixel. The 2020, 2022, and 2023 versions instead incorporate climatic variables drawn from Daymet, a well-established daily surface weather and climatology dataset. This substitution gives the imputation model a more direct and dynamically updated picture of the temperature and precipitation regimes that shape which trees can grow where, an improvement that matters as climate shifts alter the suitability of landscapes for particular species.
The second upgrade involves validation, the process by which the researchers test how well the imputed maps reproduce reality. Independent validation is notoriously difficult in imputation studies because the model is built from FIA plots, so testing it against the same plots risks circularity. In the new versions, the team refined their independent validation by restricting the analysis to FIA plots where any heterogeneity was administrative rather than ecological, and by excluding plots that had previously been used to validate earlier TreeMap versions spanning heterogeneous forest conditions. The result is a cleaner, more honest assessment of how well the maps perform in forests the model has not effectively already seen.
The third and perhaps most consequential improvement targets species range mapping. In earlier versions, the random forests imputer could, in principle, assign to a pixel an FIA plot dominated by a species that has no plausible business occurring there, a known artifact of purely statistical matching. The new releases implement a constraint on the pool of FIA plots available for imputation within each LANDFIRE zone: only plots documenting species recorded within that zone or its adjacent zones are eligible for matching. This biogeographic sanity check dramatically reduces implausible species assignments across the country, ensuring that a map user in, say, the shortgrass prairie margin does not encounter a phantom stand of boreal conifers.
Why does tree-level detail matter so much? The answer lies in the way forests interact with the Earth system. Carbon cycling models, for instance, need to know not just how much wood a landscape holds but how it is distributed among species and size classes, because decay rates, growth trajectories, and disturbance vulnerability all vary with those attributes. Fire behavior models, which the Missoula team knows intimately, depend on fuel characteristics that emerge from the arrangement of individual trees, snags, and understory vegetation. Habitat distribution models for species ranging from woodpeckers to butterflies hinge on fine-grained structural features, such as canopy closure and the presence of large-diameter trees, that only tree-level data can supply.
The temporal dimension of the new releases adds further value. By producing versions for 2020, 2022, and 2023, the team has created a short time series that captures the rapid changes sweeping through American forests, from insect outbreaks and drought-induced mortality to timber harvests and increasingly frequent wildfires. Researchers can now examine how forest composition and structure are evolving on an annual to biennial cadence at national scale, a capability that becomes ever more critical as disturbance regimes intensify under a warming climate. Each version is publicly available through the Forest Service Research Data Archive, and the model code has been released on GitHub, reflecting a broader push toward reproducibility and open science in federal research.
The implications extend well beyond the research community. Land managers weighing fuel treatments can use TreeMap to estimate how a prescription would alter stand structure across thousands of hectares without visiting every acre. Carbon accounting efforts, including those tied to emerging markets and national greenhouse gas reporting, gain a higher-resolution foundation for estimating stocks and fluxes. Conservation planners can map habitat features at a scale that matches the movements of the organisms they are trying to protect. And because the datasets are freely available, they lower the barrier for state agencies, tribes, universities, and nonprofits to conduct analyses that once required substantial computational and statistical infrastructure.
There are, of course, limits to what imputation can achieve. TreeMap is a model, not a census, and its accuracy depends on the quality of the underlying FIA measurements, the LANDFIRE grids, and the predictor variables that link them. The team’s careful refinements to validation and species constraints acknowledge these limits and push the framework toward greater realism. As the datasets move through peer review and into the hands of the modeling community, they are likely to become a standard reference point for anyone asking what America’s forests look like, tree by tree, in a rapidly changing century. In an era when forest questions have become climate questions, that kind of clarity is not a luxury; it is a necessity.
Subject of Research: Tree-level imputed forest structure and composition mapping across the conterminous United States
Article Title: TreeMap 2020, 2022, and 2023: Improved species range mapping in a tree-level forest dataset for the conterminous United States
Article References: Riley, K., Houtman, R., Zimmer, S., Leatherman, L., Peeler, J., Shaw, J., Grenfell, I., Borja Arboleda, M., Shrestha, A., Housman, I., & Finney, M. (2026). TreeMap 2020, 2022, and 2023: Improved species range mapping in a tree-level forest dataset for the conterminous United States. https://doi.org/10.5194/essd-2026-633
Image Credits: AI Generated
Keywords: TreeMap, forest mapping, FIA, random forests imputation, LANDFIRE, Daymet, species range, wildfire behavior, carbon cycling, habitat modeling, remote sensing, US Forest Service
Cite Scienmag News
Violet Maxwell. (October 11, 2026). New TreeMap maps bring tree-level forest detail to every corner of the United States. Scienmag. https://scienmag.com/new-treemap-maps-bring-tree-level-forest-detail-to-every-corner-of-the-united-states/
Violet Maxwell. "New TreeMap maps bring tree-level forest detail to every corner of the United States." Scienmag, 11 October 2026, https://scienmag.com/new-treemap-maps-bring-tree-level-forest-detail-to-every-corner-of-the-united-states/. Accessed 11 October 2026.
Violet Maxwell. "New TreeMap maps bring tree-level forest detail to every corner of the United States." Scienmag. October 11, 2026. https://scienmag.com/new-treemap-maps-bring-tree-level-forest-detail-to-every-corner-of-the-united-states/


