Spatial transcriptomics has transformed how biologists study tissue architecture, allowing researchers to measure gene expression across intact tissue sections rather than in dissociated cells. Yet a stubborn analytical problem has persisted: when scientists hunt for genes whose activity varies across a tissue, they often cannot tell whether the pattern reflects genuine spatial organization or simply the uneven distribution of cell types.
The method, described in BMC Methods, addresses a long-standing confound in spatially resolved transcriptomics (SRT) analysis. Researchers seeking spatially differentially expressed genes, or sp-DEGs, ideally want to distinguish variability driven by the spatial arrangement of cell types from spatial variation that is independent of cell type. Existing approaches often blur these two signals. In extreme cases, a region composed entirely of a cell type absent elsewhere can yield differentially expressed genes that merely reflect cell type differences rather than true spatial variation.
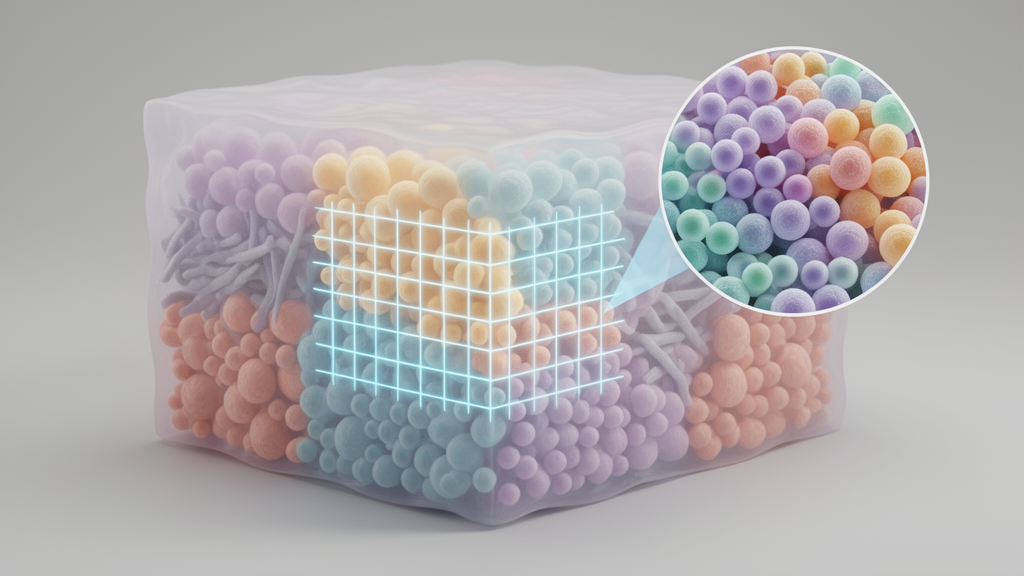
Concordex builds a k-nearest-neighbor graph from spatial coordinates or transcriptomic profiles, then computes what the authors call a neighborhood consolidation matrix. Each row of this matrix records, for a given cell or spot, the fraction of its neighbors carrying each label. When discrete cell type annotations are available, the entries directly quantify neighborhood composition. Crucially, the method also accepts continuous labels, such as principal component scores, sidestepping the need for pre-annotated cell types, which are often unavailable or imprecisely defined. Clustering the rows of the matrix assembles cells into what the authors term spatial homogeneous regions, or SHRs: areas sharing similar proportions of cell types, whether as mixtures or as regions dominated by a single type.
The team deliberately introduced the SHR terminology to separate the biological object of interest from the algorithms used to detect it. In their view, existing tools define spatial domains tautologically, as whatever output their particular procedure produces. Methods such as Giotto and BayesSpace rely on hidden Markov random fields, BANKSY augments gene expression with neighborhood information before clustering, and SpaGCN and STAGATE use graph convolutional neural networks. The authors argue that these expression-based approaches can confound the interpretation of spatial domains with the procedure used to generate them, and often overlook cell type heterogeneity within a region.
Benchmarking began with synthetic controls. The researchers simulated a chessboard pattern containing two cell types, with each square holding a distinct mixture, one square 80 percent of one type and 20 percent of the other, and the adjacent square the reverse. Concordex reconstructed the chessboard squares accurately, and each detected region contained the expected proportions of the simulated cell types. Notably, the method relied on compositional changes rather than gene expression to determine regional boundaries. Among six comparison methods, STAGATE and BANKSY produced recognizable chessboards with relatively high accuracy, while BayesSpace and SpaGCN reproduced individual cell type assignments instead of aggregating points into regions, and Giotto and GASTON failed to produce a recognizable chessboard at all.
The method then faced real biological data. Across 12 manually annotated sections of the human dorsolateral prefrontal cortex acquired on the 10x Genomics Visium platform, concordex consistently identified the expected cortical layers. Because Visium lacks cellular resolution and deconvoluted cell type predictions were unavailable for the spots, the team used the first 50 principal components to compute the neighborhood consolidation matrix. Measured by adjusted mutual information, a metric suited to unbalanced clusters, concordex performed consistently across sections, and in the example section 151675 its predictions generally agreed with ground truth annotations while representing a qualitative and quantitative improvement over several competing methods.
Speed proved to be another distinguishing feature. On a MERFISH dataset of the mouse liver containing 367,335 cells, downsampled to subsets ranging from 13,000 to 123,000 cells, concordex was by far the fastest method tested, reflecting optimized nearest-neighbor and clustering algorithms. That efficiency enabled rapid identification of villus, crypt, and muscular structures in a VisiumHD dataset of the mouse small intestine using putative cell type annotations as input. The authors note that as platforms like VisiumHD continue to enhance the resolution and throughput of spatial transcriptomic data, computational efficiency will become increasingly critical for practical region identification.
Cellular-resolution data provided a further test. Applying concordex to an adult mouse primary visual neocortex profiled with STARmap, which captured 1,020 genes in 1,207 cells along with molecularly defined cell types and annotated anatomical regions, the predicted SHRs agreed well with the annotations under default parameters. Even when specific cell types appeared in multiple cortical layers in similar proportions, such as eL2/3 cells in layers 1 and 2/3, concordex resolved the layers correctly because it clusters cells on the basis of local neighborhood composition. Validation with known marker genes reinforced the result: Slc17a7 expression spanned all cortical layers while excluding white matter and hippocampus, Lamp5 marked the upper layers, and Pcp4 localized to upper layers five and six, with these expression patterns mapping onto the predicted regions.
The payoff of accurate region identification came in the search for spatially variable genes. In a Slide-Seq V2 mouse cerebellum dataset containing 10,121 genes and 9,985 cells, the SHRs identified by concordex showed qualitative agreement with annotations from the Allen Brain Reference Atlas. The team then fitted a Negative Binomial generalized linear model including cell type, SHR, an interaction term between the two, and an offset for sequencing depth. In total, 1,246 genes could be explained by cell type, SHR, or an interaction. Genes without an interaction effect were dominated by cell type terms, showed smaller spatial effects, and generally lacked spatial autocorrelation as measured by Moran’s I. Genes with an interaction, by contrast, displayed strong spatial autocorrelation and larger effects overall, identifying a cell type within a defined spatial region rather than broadly.
One gene stood out as a clear outlier: Aldoc, which in the cerebellum is predominantly expressed by Purkinje cells yet exhibits strong spatial patterning in alternating parasagittal bands. The banding pattern was apparent in the Slide-Seq data, and expression of the gene by other cells in the layer contributed to a spatial-interaction effect stronger than the Purkinje-specific interaction effect. The authors caution that when cell type labels are used, densely populated cells with identical neighborhoods may be grouped into a single SHR that does not correspond to a histological feature, though they view this as informative about tissue organization such as varying cell density. Concordex also extends beyond spatial data, assessing cluster boundaries and relationships in non-spatial single-cell RNA sequencing experiments. The tool is freely available as a Bioconductor package, with source code and a Python version hosted on GitHub, and the authors suggest future work should focus on identifying genes with regionally restricted expression and distinguishing that pattern from cell type localization.
Subject of Research: A computational method for identifying spatially homogeneous tissue regions in spatial transcriptomics data
Article Title: Characterization of spatial homogeneous regions in tissues with concordex
Article References: Jackson, K. C., Booeshaghi, A. S., Gálvez-Merchán, Á., Moses, L., Chari, T., Kim, A., Hosten-Mittermaier, O., & Pachter, L. (2026). Characterization of spatial homogeneous regions in tissues with concordex. BMC Methods, 3(1), Article 34. https://doi.org/10.1186/s44330-026-00086-3
Image Credits: AI Generated
DOI: 10.1186/s44330-026-00086-3
Keywords: spatial transcriptomics, concordex, spatial homogeneous regions, cell type composition, spatially variable genes, k-nearest-neighbor graph, gene expression, Visium, STARmap, Slide-Seq V2, negative binomial GLM, tissue architecture
Cite Scienmag News
Juliet Wilcox. (October 29, 2026). New Tool Maps Tissue Regions by Cell Type Composition. Scienmag. https://scienmag.com/new-tool-maps-tissue-regions-by-cell-type-composition/
Juliet Wilcox. "New Tool Maps Tissue Regions by Cell Type Composition." Scienmag, 29 October 2026, https://scienmag.com/new-tool-maps-tissue-regions-by-cell-type-composition/. Accessed 29 October 2026.
Juliet Wilcox. "New Tool Maps Tissue Regions by Cell Type Composition." Scienmag. October 29, 2026. https://scienmag.com/new-tool-maps-tissue-regions-by-cell-type-composition/