


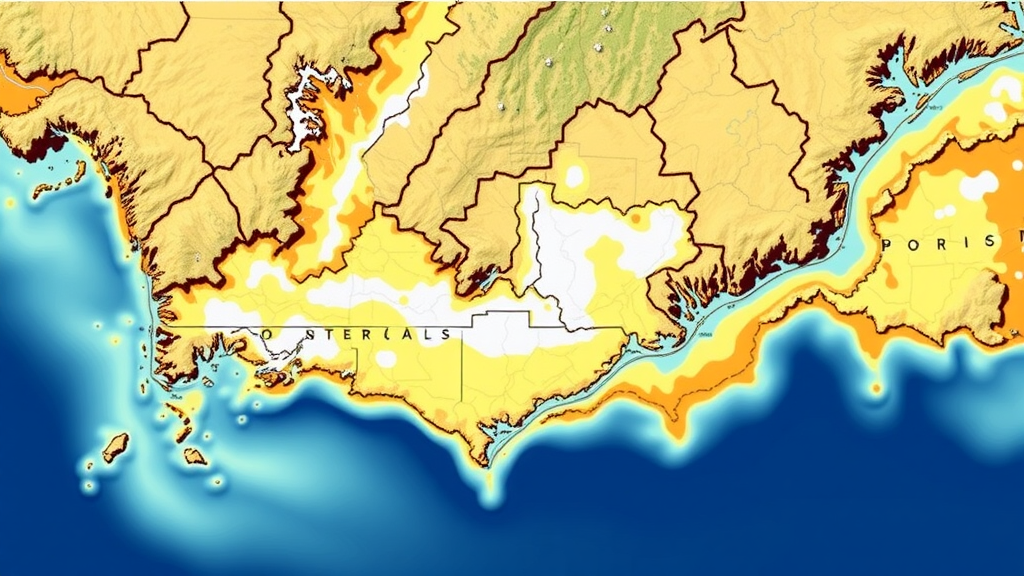
Salinity is one of the most powerful forces shaping life in an estuary. It determines where fish spawn, where bivalves settle, and where mangrove-associated invertebrates can survive. Now, a team of Brazilian and Australian researchers has developed a new mapping technique that turns simulated salinity data into ecologically meaningful maps, revealing how dam operations quietly redraw the biological geography of a tropical estuary. The study, published in the journal Discover Oceans, focuses on the Paraguaçu River estuary in northeastern Brazil, where the Pedra do Cavalo dam has regulated freshwater flow since the early 1980s.
The method, called Salinity Zones Distribution (SZD) mapping, was created by T. S. Franklin of the Federal University of Bahia, together with P. C. C. Rosman of the Federal University of Rio de Janeiro and R. C. Carvalho of James Cook University. Rather than simply averaging salinity values across space and time, the technique counts how often each salinity class occurs at every point in the estuary over a full calendar year. The class that dominates most frequently is assigned to that location, producing a map of the most permanent ecological salinity conditions rather than a smoothed statistical blur.
To generate the underlying salinity fields, the team used TELEMAC-2D, a depth-averaged hydrodynamic model that solves the vertically averaged Navier-Stokes equations for free-surface flow and salinity transport. The model domain was discretized with a finite-element mesh of 34,699 triangular elements ranging from 16 to 700 meters, built from bathymetric data supplied by the Brazilian Navy and earlier field campaigns. Tidal forcing came from harmonic constituents measured at the Madre de Deus terminal, while salinity at the ocean boundary was set from moored sensor data collected between 2012 and 2014 near the estuary mouth in Todos os Santos Bay.
Validation was extensive and multi-metric. Water levels at stations near the estuary head and mouth achieved Model Prediction Skill values above 0.9, with root-mean-square errors of 0.12 and 0.29 meters respectively, well below the local tidal range. Depth-averaged currents at three mid-channel sections reached Skill values between 0.85 and 0.95. Salinity validation across five stations produced Skill values from 0.53 to 0.91, and the researchers were careful to explain that low Skill at the euhaline mouth station reflects the extremely narrow observed salinity range there rather than poor physical performance. Crucially, all salinity biases remained smaller than the width of any salinity class in the Venice System, the classification scheme adopted for the ecological zoning.
That classification, first consolidated at the 1958 Venice symposium, divides aquatic environments into five zones from limnetic fresh water below 0.5 practical salinity units to marine waters above 30 psu. It remains the most widely used framework for salinity-based ecological zones, and the SZD method can accommodate it or any alternative scheme, including multivariate classifications derived from local biological data. For each month of the simulated year, the researchers computed the dominant salinity class at every mesh node, resolving ties in favor of the class with the narrower salinity range to minimize classification uncertainty.
The team ran two contrasting scenarios for 2010, a year chosen because its wet and dry seasons were typical and because fish survey data were available. In the Natural scenario, freshwater inflow to the estuary equaled the river inflow entering the dam reservoir. In the Regulated scenario, inflow reflected the actual operation of Pedra do Cavalo, which releases water in daily pulses of roughly 45 cubic meters per second for four to eight hours, driven by electricity generation norms and a minimum sanitary discharge of about 10 cubic meters per second. The contrast between these two worlds proved dramatic.
Under regulated flows, polyhaline conditions between 18 and 30 psu dominated Iguape Bay for most of the year, whereas natural flows would have produced euhaline conditions above 30 psu much of the time. During the dry month of February 2010, the limnetic zone extended only 3 kilometers downstream of the dam under natural conditions but stretched 10 kilometers under regulation. Conversely, during the April 2010 flood, when natural discharges exceeded 1,000 cubic meters per second, the upper estuary shifted abruptly to limnetic conditions and the mesohaline zone expanded deep into Iguape Bay. The regulated regime, in short, holds the estuary in a persistently saltier state in the bay while pushing fresher, more variable conditions into the upstream channel.
The ecological consequences follow directly from the maps. Previous fish surveys in the Paraguaçu estuary identified three guilds: estuarine residents that complete their entire life cycle within the estuary, estuarine migrants with larval stages outside it, and marine stragglers that venture in from the sea. Estuarine residents concentrate in salinities of 18 to 26 psu, squarely within the polyhaline class that regulation now sustains in Iguape Bay, suggesting these fish may benefit. But the simulations also show that regulated discharges impose limnetic conditions along the channel upstream of the bay, implying significant stress for the oligohaline and mesohaline biota that historically inhabited those reaches, including larval and juvenile fishes that depend on low-salinity nursery habitats.
Benthic communities tell a parallel story. Local studies of the Paraguaçu system show a clear longitudinal replacement of taxa along the salinity gradient, with bivalves of the families Tellinidae and Veneridae, cirolanid isopods, cyclopoid copepods and nereidid polychaetes dominating low-salinity sectors, while nuculid bivalves, cirratulid polychaetes and amphiurid brittle stars characterize high-salinity, finer-sediment areas. The SZD maps can therefore be read as habitat-suitability predictors: expansion of polyhaline and euhaline zones under regulation should favor the marine-affiliated assemblages, while shrinking the spatial footprint available to freshwater-tolerant taxa. The framework also connects to broader phenomena, since the position of the low-salinity front relates to the estuarine turbidity maximum, where nutrients and phytoplankton concentrate and where algal blooms, including the red tide recorded in the bay in 2007, can originate.
Beyond its immediate findings, the study positions SZD mapping as a versatile management tool. The authors argue it can support environmental flow planning, help resolve conflicts between dam operators and artisanal fishing communities such as those in the Iguape Bay Extractive Reserve, guide aquaculture siting for species like the mangrove oyster whose larvae favor 25 to 30 psu, and even serve as a climate-change indicator by mapping how sea-level rise and altered rainfall shift salinity zones. Because the method works with any salinity classification and any estuary with hydrodynamic model output, the researchers believe it offers a practical, visually intuitive foundation for sustainable catchment management worldwide, from the lagoon of Venice to dam-removal sites on the Elwha River.
Subject of Research: A novel salinity zone mapping method for assessing how dam-regulated freshwater inflow alters ecological salinity zones in estuaries
Article Title: Evaluating salinity alterations in estuaries through ecological mapping
Article References: Franklin, T. S., Rosman, P. C. C., & Carvalho, R. C. (2026). Evaluating salinity alterations in estuaries through ecological mapping. Discover Oceans, 3(1), Article 46. https://doi.org/10.1007/s44289-026-00159-9
Image Credits: AI Generated
DOI: 10.1007/s44289-026-00159-9
Keywords: estuary, salinity, hydrodynamic modelling, Venice System, freshwater regulation, Paraguaçu River, Todos os Santos Bay, ecological zonation, environmental flows, benthic fauna, fish habitat, dam impacts
Cite Scienmag News
Violet Maxwell. (September 22, 2026). New Salinity Maps Reveal How Dams Reshape Estuarine Ecosystems. Scienmag. https://scienmag.com/new-salinity-maps-reveal-how-dams-reshape-estuarine-ecosystems/
Violet Maxwell. "New Salinity Maps Reveal How Dams Reshape Estuarine Ecosystems." Scienmag, 22 September 2026, https://scienmag.com/new-salinity-maps-reveal-how-dams-reshape-estuarine-ecosystems/. Accessed 5 October 2026.
Violet Maxwell. "New Salinity Maps Reveal How Dams Reshape Estuarine Ecosystems." Scienmag. September 22, 2026. https://scienmag.com/new-salinity-maps-reveal-how-dams-reshape-estuarine-ecosystems/


