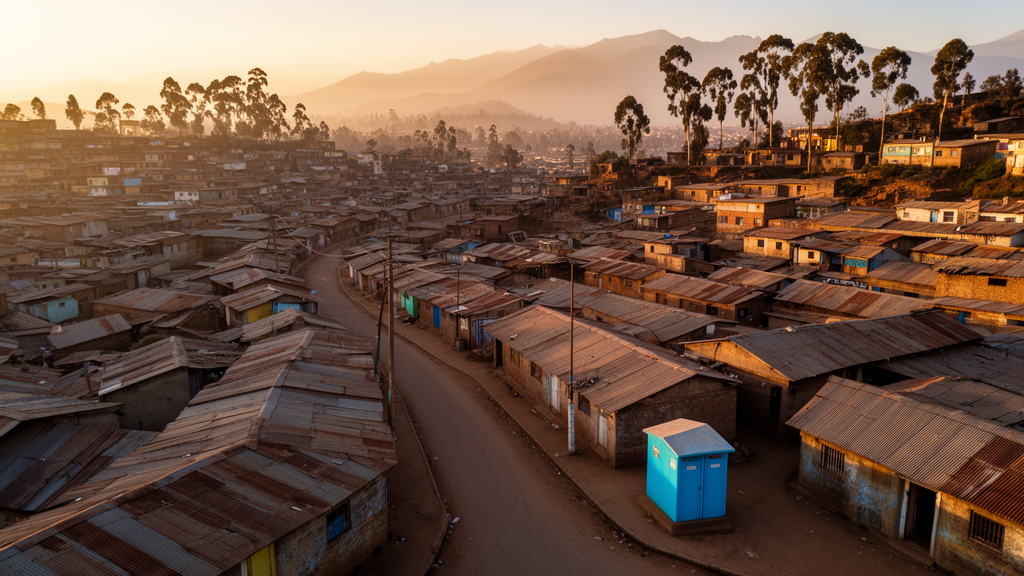
Only about a quarter of Addis Ababa’s residents can reach a public toilet within a reasonable walk, according to a new spatial analysis of sanitation provision in Ethiopia’s capital. Using a geographic information system combined with multi-criteria decision analysis, researchers mapped where the city’s public toilets stand, how far most people must walk to reach one, and where new facilities would do the most good. The study, published in the journal City and Built Environment, found that just 25.07 percent of the analytical population of 3,280,422 residents lives within 500 meters of an existing public toilet, the walking-distance benchmark drawn from World Health Organization and UNICEF planning guidance. The remaining 74.93 percent, roughly 2.46 million people, live beyond that threshold.
The evidence base for the analysis was a field inventory of 339 public toilets, compiled between January and June 2024. Field teams visited facilities across all 11 sub-cities and 116 woredas of the city, recording coordinates with handheld GPS receivers accurate to about three meters and validating positions against municipal records and high-resolution satellite imagery. Rather than measuring straight-line distances, which can overstate pedestrian access by ignoring barriers and irregular street layouts, the researchers calculated shortest walking paths along a topologically corrected road network. Their cumulative distance bands show how sharply access falls off: 1.70 percent of residents are within 100 meters of a facility, 5.15 percent within 200 meters, 8.97 percent within 300 meters, 25.07 percent within 500 meters, and 59.11 percent within 1,000 meters.
The distribution of the existing facilities is strikingly uneven. More than 34 of the city’s 116 woredas contain either no public toilet or just one, while only a small number of woredas have eight or more. Facility density ranges from roughly seven facilities per square kilometer in the central sub-city of Addis Ketema to about one per square kilometer in Bole, Yeka, and Lemi Kura. At the finest scale, a 0.1-square-kilometer grid comparison revealed a stark mismatch between supply and demand: the most densely populated grid cells, each holding more than 400 residents, contain only eight public toilets in total, while some sparsely populated cells hold as many as eleven.
Population-to-facility ratios quantify the imbalance. Addis Ketema’s 33 inventoried toilets serve approximately 443,149 residents, about 13,429 people per facility. Yeka’s 23 facilities serve roughly 308,257 people, about 13,403 per facility, and Lemi Kura’s 25 facilities serve about 237,849 people, roughly 9,514 per facility. By contrast, Nifas Silk-Lafto and Kolfe-Keraniyo show comparatively better provision with 51 and 45 toilets respectively. The authors caution that the inventory records locations rather than verified daily functional capacity, since a separate operational-status audit was not conducted for every facility.
To identify where new toilets would be most useful, the team built a suitability model from eight spatial criteria: population density, proximity to public activity nodes such as markets and transit stops, road-network accessibility, distance from existing facilities, land use and land cover, slope, soil type, and distance from rivers. Each criterion was standardized to a one-to-five suitability scale. The relative weights came from the Analytical Hierarchy Process, in which nine experts, including municipal planners, public-health officers, sanitation engineers, and university researchers, performed 28 pairwise comparisons each. The aggregated judgments were highly internally consistent, with a consistency ratio of 0.0152, well below the conventional 0.10 acceptability threshold. Demand-related criteria received 49 percent of the total weight and accessibility criteria 30 percent, leaving 21 percent for physical and environmental factors.
The weighted overlay classified 87.97 square kilometers, about 20 percent of the city’s roughly 430-square-kilometer extent, as high or very high suitability for public toilet development. Binary constraints were applied separately from the graded criteria: a 200-meter exclusion buffer around existing facilities to prevent redundant investment, a 50-meter road right-of-way buffer, a 50-meter river protection buffer, exclusion of slopes steeper than 25 degrees, and removal of water bodies and protected land uses. The researchers deliberately kept the service-gap map conceptually separate from the suitability model, so that a location with severe shortage but poor slope, soil, or environmental conditions would not be prioritized for construction solely because of need.
Overlaying the suitability surface with the service-deficit map and a building-footprint layer from the 2023 Google Open Buildings dataset narrowed the planning envelope to 25.43 square kilometers, or 5.91 percent of the city, where high demand, inadequate service, and preliminarily available land coincide. The authors stress that this priority zone is a screening result, not a construction-ready site inventory. Building-footprint absence indicates only possible land availability, not confirmed ownership, tenure status, utility connections, or construction permissions, and every candidate parcel requires field verification before any site is selected.
Because expert weights and threshold choices can shape such models strongly, the team ran a sensitivity analysis with four alternative weighting scenarios and eight threshold variations. The high and very-high suitability area ranged from 70.61 to 111.40 square kilometers across scenarios, compared with 87.97 square kilometers in the baseline. Spatial overlap with the baseline mask ranged from 79.7 to 100 percent, and Jaccard similarity ranged from 0.602 to 0.973, indicating that the broad spatial pattern of priority areas remained relatively stable even as total extent shifted. The results were most sensitive to environmental-emphasis weighting, which increased the suitable area by 26.6 percent, and to the existing-facility exclusion distance, where widening the buffer from 200 to 250 meters reduced the area by 19.7 percent.
Model validation was necessarily partial. Because the 339 observed facilities informed the model itself, particularly the distance-from-existing-facilities criterion, comparison against them is diagnostic rather than fully independent. Observed facilities scored significantly higher than 3,000 random background points from the eligible planning domain, and 74.3 percent of facilities fell within the high or very-high suitability classes. The apparent area under the ROC curve was 0.662, while a spatial five-fold cross-validation, which rebuilt the facility-distance criterion from 80 percent of facilities in each fold, yielded a cross-validated AUC of 0.864. The authors explain that the higher cross-validated figure reflects recomputing the facility criterion without the held-out facilities, and that neither statistic constitutes a fully independent predictive validation.
The study’s limitations are explicit. The 2020 WorldPop population data may not capture temporal movement around markets and transit hubs, the model incorporates physical and spatial criteria rather than social and behavioral factors such as perceived safety, gender-specific requirements, cleanliness, and affordability, and the single-city results should not be directly generalized. The authors also note that the 500-meter and 1,000-meter deficits are planning-oriented estimates, not direct measures of facility use or open-defecation prevalence. Within those bounds, the framework offers municipal planners a transparent, reproducible workflow for prioritizing sanitation investment in a data-constrained setting, while the authors emphasize that tenure screening, community engagement, disability-responsive design, and environmental compliance remain essential steps between a priority map and any built facility.
Subject of Research: A GIS and multi-criteria decision analysis of public toilet accessibility deficits, site suitability, and priority intervention zones in Addis Ababa, Ethiopia
Article Title: GIS-based multi-criteria spatial decision support for equitable public toilet planning: mapping accessibility deficits, site suitability and priority intervention zones in Addis Ababa, Ethiopia
Article References: Engda, E. M., Herchema, M., Mekonnen, Z. A., Dararo, K. F., Tiye, F. S., & Jothimani, M. (2026). GIS-based multi-criteria spatial decision support for equitable public toilet planning: mapping accessibility deficits, site suitability and priority intervention zones in Addis Ababa, Ethiopia. City and Built Environment, 4(1), Article 21. https://doi.org/10.1007/s44213-026-00088-5
Image Credits: AI Generated
DOI: 10.1007/s44213-026-00088-5
Keywords: Addis Ababa, public toilets, sanitation, GIS, multi-criteria decision analysis, Analytical Hierarchy Process, spatial accessibility, urban planning, Ethiopia, network analysis, suitability mapping, spatial equity
Cite Scienmag News
Denise Maddox. (October 27, 2026). Most of Addis Ababa lives too far from a public toilet, GIS study finds. Scienmag. https://scienmag.com/most-of-addis-ababa-lives-too-far-from-a-public-toilet-gis-study-finds/
Denise Maddox. "Most of Addis Ababa lives too far from a public toilet, GIS study finds." Scienmag, 27 October 2026, https://scienmag.com/most-of-addis-ababa-lives-too-far-from-a-public-toilet-gis-study-finds/. Accessed 28 October 2026.
Denise Maddox. "Most of Addis Ababa lives too far from a public toilet, GIS study finds." Scienmag. October 27, 2026. https://scienmag.com/most-of-addis-ababa-lives-too-far-from-a-public-toilet-gis-study-finds/