


Hearing loss is one of the most common chronic conditions of aging in the United States, affecting roughly 30 million Americans and about two-thirds of adults in their seventies. Yet a new nationwide analysis of Medicare billing data reveals that the care designed to help these patients is distributed across the American map with startling unevenness. In a study published in Frontiers in Audiology and Otology, researchers led by Jeffrey Li of the Carle Illinois College of Medicine mapped five years of hearing-related Medicare services, county by county, and found that utilization clusters into sharply defined hot spots and cold spots that track poverty, income, education, and population density far more closely than they track clinical need.
The research team performed a retrospective cross-sectional ecological analysis using publicly available county-level data from 2017 through 2021, drawn from three federal sources: physician billing records from the Centers for Medicare and Medicaid Services, demographic and socioeconomic estimates from the US Census Bureau’s American Community Survey, and rural-urban and economic indicators from the USDA Economic Research Service. Hearing-related procedures were identified using 35 Healthcare Common Procedure Coding System codes with complete five-year coverage, selected from a larger candidate list of 73 codes classified by the American Speech-Language-Hearing Association. The retained codes spanned the diagnostic core of hearing care, including audiometry, tympanometry, distortion product otoacoustic emissions, auditory evoked potentials, and cochlear implant analysis.
The scope of the dataset was enormous. Of 3,109 counties in the contiguous United States, 1,340 had any hearing-related Medicare billing activity during the study window and were included in the spatial analysis, together encompassing approximately 290.7 million residents. Across the five years, providers billed 15,136,056 hearing-related procedures at a total Medicare payment of 428.3 million dollars, an average of about 85.7 million dollars per year. The temporal pattern echoed the pandemic’s disruption of routine medicine: volume grew roughly 2 percent annually from 2017 to 2019, plunged about 24 percent in 2020, and recovered only partially in 2021. Over the full period, hearing services represented just a quarter of one percent of total Medicare procedure volume and expenditure.
To determine whether this activity was scattered randomly across the landscape or organized into coherent geographic patterns, the researchers applied two spatial statistics computed in the Python Spatial Analysis Library. First, they calculated global Moran’s I, a measure of spatial autocorrelation that asks whether counties with similar service volumes sit near one another more often than chance would predict. The result was unambiguous: Moran’s I was 0.49 with a p-value below 0.01 and a z-score of 20.4, indicating strong positive spatial autocorrelation. In plain terms, busy hearing-care counties were next to other busy counties, and quiet counties bordered other quiet counties, forming a pattern far too structured to be random.
The team then deployed Local Indicators of Spatial Association, or LISA, a technique that classifies each county by comparing its own value to the national mean and to the average of its contiguous neighbors, using a row-standardized first-order Queen contiguity weights matrix and 9,999 random permutations to compute significance. A high-high county, or hot spot, has above-average volume and above-average neighbors; a low-low county, or cold spot, is the reverse; high-low and low-high outliers mark a county that diverges from its surroundings. The classification is statistical rather than arbitrary: a county earns a cluster label only if its local Moran statistic reaches significance at the 0.05 level. Notably, the researchers ran the clustering on raw service volume rather than per-capita rates, arguing that LISA is designed to detect structure in the variable as geographically distributed and that a population denominator would have conditioned the results on that choice. Per-capita figures appeared only as descriptive overlays.
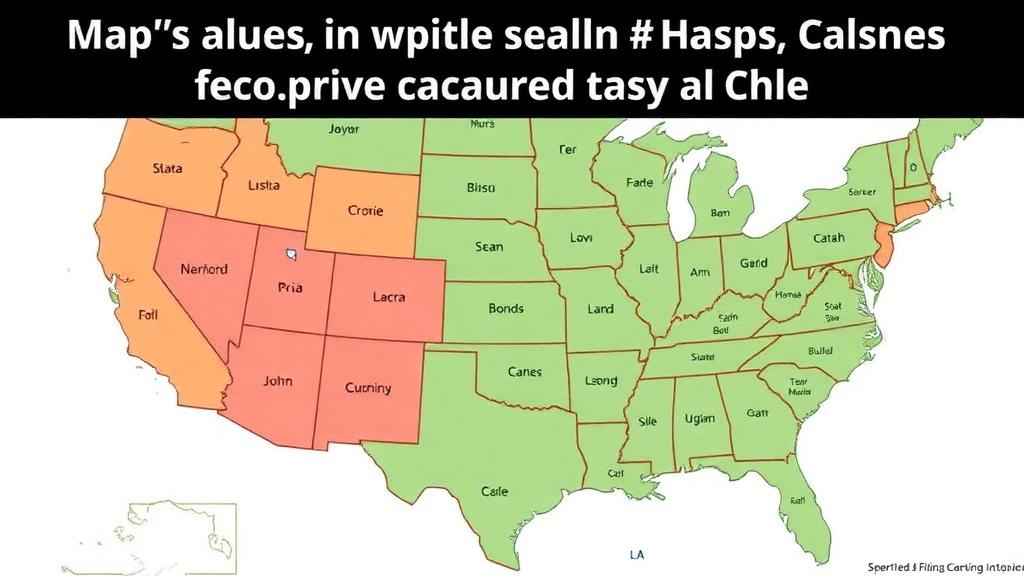
The resulting map is stark. Sixty-eight counties, concentrated in Southern California, Florida, Texas, the Mid-Atlantic corridor, and the Finger Lakes region of New York, qualified as hot spots. These 68 counties are home to 75.5 million people and absorbed 4.9 million procedures and 159 million dollars in Medicare hearing-care spending over five years. At the other extreme, 125 counties, primarily across the Midwest and the Deep South, emerged as cold spots, serving 5.2 million residents through just 316,177 procedures and 7.3 million dollars in spending. Thirty-five counties registered as spatial outliers of one kind or another, while more than 1,100 analyzed counties showed no significant clustering. Most striking of all, 1,769 contiguous US counties had no hearing-related Medicare billing activity at all during the entire five-year window.
When the researchers compared the clusters across roughly 50 socioeconomic variables using one-way ANOVA with Tukey post-hoc tests, the contrasts were dramatic. Cold-spot counties had higher poverty rates than hot spots, 14.7 percent versus 11.3 percent, and median household incomes of 56,239 dollars versus 86,972 dollars. Only 23.6 percent of cold-spot adults held a bachelor’s degree or higher, compared with 40.2 percent in hot spots. Population density differed by nearly two orders of magnitude, with hot spots averaging 4,879 residents per square mile against 70 in cold spots. Crucially, the age structure argues against a simple demographic explanation: cold spots actually had a higher proportion of residents aged 65 and older, 19.9 percent versus 16.6 percent, the opposite of what would be expected if raw utilization merely tracked the Medicare-eligible population. The regions with the most older adults are receiving the least hearing care.
The racial and ethnic picture requires careful reading. Hot-spot counties showed greater diversity, with higher mean proportions of Hispanic residents, 22.5 percent versus 7.0 percent, Asian residents, 8.5 percent versus 1.5 percent, and Black residents, 13.0 percent versus 7.6 percent, along with higher shares of foreign-born residents and non-English-speaking households. The researchers caution that this does not imply higher individual-level utilization among minoritized groups; prior beneficiary-level studies consistently find that Black and Hispanic older adults with hearing loss are less likely than White older adults to use hearing aids, even at the same income levels. Their findings instead suggest a county-by-individual interaction: minoritized populations are concentrated in metropolitan counties with the most hearing-care infrastructure, yet within those very counties they remain less likely to access services.
Why does hearing care concentrate so heavily in affluent coastal metros? The authors point to workforce maldistribution as a primary driver. Nationally there are only about 4.6 audiologists per 100,000 people, and recent workforce projections suggest non-metropolitan otolaryngology adequacy could fall to roughly 35 percent by 2036 while metropolitan areas approach 98 percent. The cold spots overlap substantially with federally designated Health Professional Shortage Areas. Cost compounds the problem: traditional Medicare has excluded hearing aids since its 1965 statute, the 2021 Build Back Better proposal to add a hearing benefit failed, and the Medicare Hearing Aid Coverage Act of 2025 remains pending. The FDA’s over-the-counter hearing-aid rule, which took effect in October 2022, created a direct-to-consumer channel spanning roughly a 30-fold price range, but whether that market will close or widen the geographic gaps documented here remains an open empirical question for post-2022 data.
The study carries important caveats. CMS billing data assign claims to provider practice location rather than patient residence, so rural beneficiaries who travel to urban specialists inflate urban volumes, sharpening the apparent divide. Excluding the 57 percent of counties with no billing activity biases the analysis toward places that already have providers, and the 1,769 silent counties may represent hearing-care deserts where claims never reached inclusion thresholds. Still, the overall conclusion is hard to escape: among the majority of US counties, either utilization was statistically sparse or entirely absent, meaning most American counties show little or no Medicare-billed hearing care. The researchers call for rural workforce incentives, integration of tele-audiology into benefit designs, federal investment in coverage equity, and targeted outreach to cold-spot counties, alongside beneficiary-level analyses to disentangle provider-location bias from true utilization gradients. As evidence mounts that treating hearing loss can slow cognitive decline, including the ACHIEVE trial’s finding of roughly 48 percent less three-year cognitive decline among high-risk adults, the map of who gets heard, and who does not, has become a matter of national urgency.
Subject of Research: Geospatial clustering of Medicare hearing-related service utilization across US counties from 2017 to 2021
Article Title: Geospatial analysis of hearing-related services utilization among Medicare beneficiaries, 2017–2021
Article References: Li, J., Veluvolu, V., Nyaeme, M., & Heuermann, M. (2026). Geospatial analysis of hearing-related services utilization among Medicare beneficiaries, 2017–2021. Frontiers in Audiology and Otology, 4, Article 1885939. https://doi.org/10.3389/fauot.2026.1885939
Image Credits: AI Generated
DOI: 10.3389/fauot.2026.1885939
Keywords: hearing loss, Medicare, geospatial analysis, health disparities, audiology, otolaryngology, LISA clusters, Moran's I, rural health, healthcare access, hearing aids, socioeconomic factors
Cite Scienmag News
Caroline Murphy. (October 15, 2026). Maps Reveal Vast Hearing Care Deserts Across Rural America. Scienmag. https://scienmag.com/maps-reveal-vast-hearing-care-deserts-across-rural-america/
Caroline Murphy. "Maps Reveal Vast Hearing Care Deserts Across Rural America." Scienmag, 15 October 2026, https://scienmag.com/maps-reveal-vast-hearing-care-deserts-across-rural-america/. Accessed 15 October 2026.
Caroline Murphy. "Maps Reveal Vast Hearing Care Deserts Across Rural America." Scienmag. October 15, 2026. https://scienmag.com/maps-reveal-vast-hearing-care-deserts-across-rural-america/


