


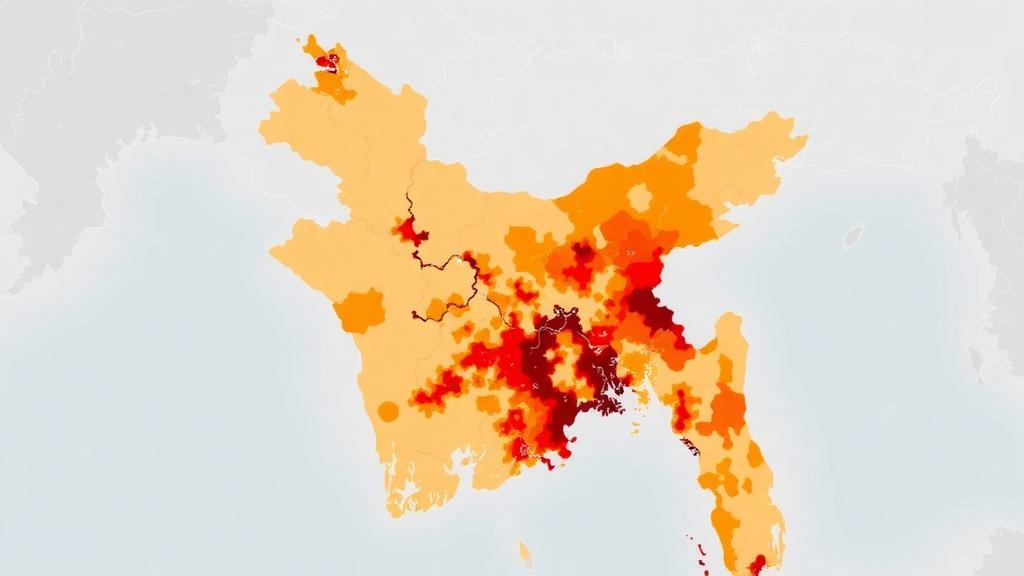
Bangladesh has long been defined in the public imagination by floods and cyclones, but a quieter and less studied hazard is steadily tightening its grip on the country: extreme heat. A new district-level assessment published in the journal Natural Hazards has produced one of the most detailed spatial portraits yet of heatwave vulnerability across the nation, and its central finding is striking. It is not simply the hottest places that face the greatest danger, but the places where high temperatures collide with dense populations, fragile social conditions, and weak infrastructure. The study, led by Sworna Akter of Jahangirnagar University with colleagues from Independent University Bangladesh, the Bangladesh Meteorological Department, and Monash University in Australia, breaks vulnerability down into three measurable components: exposure, sensitivity, and adaptive capacity, and maps each one across the country’s districts.
The framework follows an approach now widely used in climate risk science, rooted in assessments by the Intergovernmental Panel on Climate Change, in which vulnerability emerges from the interaction of a hazard, the characteristics of the people exposed to it, and their ability to cope. Exposure in this study was quantified using satellite-derived land surface temperature, often abbreviated LST, combined with population density. Land surface temperature is a powerful proxy for heat stress because it captures the actual thermal signature of the ground, which in densely built urban environments can far exceed the air temperature recorded at weather stations. Pairing this thermal data with population density allows the researchers to identify not just where it is hot, but where heat and human presence overlap most intensively.
Sensitivity, the second pillar of the index, captures how susceptible a population is to harm when heat arrives. The researchers assembled a broad set of socioeconomic indicators: the proportion of elderly people, very young children, and women; illiteracy rates; the extent of built-up area; poverty levels; access to water; unemployment; occupational structure; and disability prevalence. Each of these factors has a documented link to heat health outcomes. Infants and the elderly regulate body temperature less efficiently, outdoor laborers accumulate dangerous heat loads, poverty limits access to cooling and healthcare, and unreliable water access undermines the single most effective defense against heat illness, which is hydration. By combining these indicators into a single composite index, normalized and aggregated using standard techniques for composite indicator construction, the team could compare districts on a common scale.
Adaptive capacity, the third component, measures what a district can draw upon to blunt the impact of a heatwave. Here the authors used vegetation cover, water resources, and electricity access, with the last of these cleverly proxied by the average radiance of nighttime lights, a satellite measurement widely used as an indicator of infrastructure development and energy availability. Green cover and water bodies cool their surroundings through evapotranspiration and evaporation, while electricity underpins fans, air conditioning, cold storage of medicines, and hospital function. A district rich in these assets can absorb a heatwave that would devastate an otherwise identical district lacking them.
The results reveal a country divided against itself by heat risk. The highest exposure scores cluster where scorching temperatures coincide with large populations: Dhaka, the crowded capital; Rajshahi in the northwest, long known as one of the hottest corners of the country; and Chattogram, the major port city in the southeast. Sensitivity, by contrast, peaks in Rangpur in the north and along the coastal belt, where poverty, illiteracy, and demographic vulnerability run high. Perhaps most concerning, the northern and southern parts of the country appear to lack the infrastructure, in the form of vegetation, water resources, and reliable electricity, that could moderate the effects of extreme heat, leaving them doubly exposed: sensitive populations with few buffers.
To test whether these regional differences were statistically meaningful rather than artifacts of the data, the authors applied the Kruskal-Wallis test, a non-parametric method for comparing multiple groups. The results were telling. Sensitivity differed significantly across divisions, with a test statistic of H = 23.13 and a p-value of 0.002, and adaptive capacity differed significantly as well, with H = 19.10 and p = 0.008. Exposure, however, showed no statistically significant divisional differences, with H = 11.94 and p = 0.10. In plain terms, heat itself is spread relatively evenly across the country, but the social fragility and the coping resources that determine whether heat becomes disaster are distributed very unevenly. This is the study’s most consequential insight: in Bangladesh, vulnerability to heatwaves is driven less by climate than by socioeconomic conditions.
The team did not stop at mapping; they stress-tested their own indices. Sensitivity analysis, a standard practice in composite indicator research, involves removing individual indicators and observing how much the resulting classifications change. The findings underscore which variables truly carry the weight. When land surface temperature was omitted, the exposure classification changed in 59.4 percent of districts, confirming that satellite thermal data is the backbone of any credible heat exposure map. When waterbody indicators were removed, adaptive capacity classifications shifted in 66.7 percent of districts, and removing vegetation cover changed classifications in 44.4 percent of districts. Together, these results identify LST, vegetation cover, and waterbodies as the strongest determinants of district-level vulnerability in the model, and they warn that any heat vulnerability assessment neglecting these environmental variables risks producing misleading rankings.
To visualize the interplay of the three components, the researchers constructed a heatwave vulnerability triangle, a ternary diagram in which each district’s position reflects the relative balance of exposure, sensitivity, and adaptive capacity. Districts pushed toward the high-sensitivity, low-capacity corner of the triangle are those where heat is most likely to translate into illness and death, even if their temperatures are not the highest in the country. This geometric representation makes the regional disparities immediately visible and offers planners an intuitive tool for prioritizing interventions. It also reinforces the paper’s argument that national heat policy cannot be uniform: the needs of Dhaka, where exposure dominates, differ fundamentally from those of Rangpur or the coastal districts, where sensitivity and weak adaptive capacity dominate.
The broader scientific context sharpens the urgency of these findings. Research on South Asian climate has projected that parts of the densely populated agricultural regions of the subcontinent could experience heat and humidity combinations approaching the limits of human tolerance under continued warming, and global studies have documented the emergence of conditions too severe for human physiology in some regions. Bangladesh, with one of the highest rural population densities on Earth, a rapidly urbanizing economy, and tens of millions of outdoor workers in agriculture and construction, sits squarely in the crosshairs. Previous city-scale studies in Dhaka, Rajshahi, and coastal Bangladesh have documented urban heat island intensity and heat-health impacts, but this new work extends the analysis systematically to the entire national territory, providing the comparable district-level baseline that adaptation planning requires.
The policy implications are clear and, in some respects, encouraging, because the factors that drive vulnerability in this analysis are ones that governments can actually change. Expanding electricity access, protecting and restoring vegetation and water bodies, targeting social protection, literacy, and healthcare toward the most sensitive districts, and designing occupational heat protections for outdoor workers would all directly reduce the sensitivity and adaptive capacity deficits the study identifies. The authors conclude that division-specific adaptation plans, focused on socioeconomically vulnerable and infrastructure-weak regions, are essential for building national heat resilience. As heatwaves intensify across South Asia in the coming decades, the lesson from Bangladesh is one that many developing countries will recognize: the thermometer tells only part of the story, and the deadliest heat will strike where climate stress meets social fragility with no buffer in between.
Subject of Research: Spatial assessment of heatwave vulnerability in Bangladesh using exposure, sensitivity, and adaptive capacity indices
Article Title: Characterising spatial patterns of exposure, sensitivity and adaptive capacity to assess heatwave vulnerability of Bangladesh
Article References: Akter, S., Mondol, M. A. H., Logna, H. R., Rahman, H., Rashid, M. B., Zhu, X., & Dunkerley, D. (2026). Characterising spatial patterns of exposure, sensitivity and adaptive capacity to assess heatwave vulnerability of Bangladesh. Natural Hazards, 122(21), Article 673. https://doi.org/10.1007/s11069-026-08432-y
Image Credits: AI Generated
DOI: 10.1007/s11069-026-08432-y
Keywords: heatwave vulnerability, Bangladesh, land surface temperature, adaptive capacity, sensitivity, spatial analysis, climate change adaptation, composite indices, Dhaka, Rajshahi, Kruskal-Wallis test, Natural Hazards
Cite Scienmag News
Sloane Callahan. (October 11, 2026). Mapping Bangladesh’s Heatwave Hotspots: Where Heat Meets Vulnerability. Scienmag. https://scienmag.com/mapping-bangladeshs-heatwave-hotspots-where-heat-meets-vulnerability/
Sloane Callahan. "Mapping Bangladesh’s Heatwave Hotspots: Where Heat Meets Vulnerability." Scienmag, 11 October 2026, https://scienmag.com/mapping-bangladeshs-heatwave-hotspots-where-heat-meets-vulnerability/. Accessed 11 October 2026.
Sloane Callahan. "Mapping Bangladesh’s Heatwave Hotspots: Where Heat Meets Vulnerability." Scienmag. October 11, 2026. https://scienmag.com/mapping-bangladeshs-heatwave-hotspots-where-heat-meets-vulnerability/


