


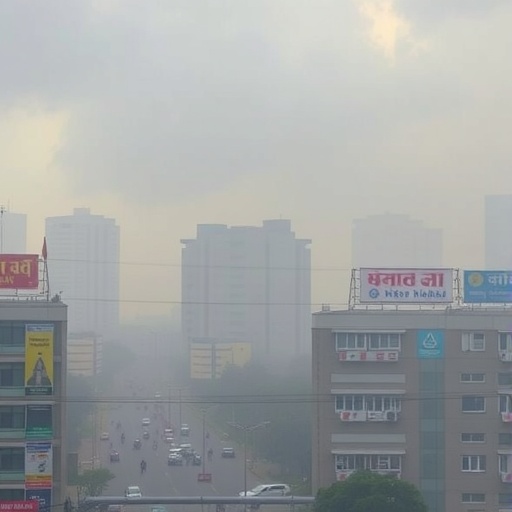
In Hyderabad, one of the fastest-growing megacities in southern India, the quality of the air can shift dramatically between morning and night—and a team of Indian researchers has now trained artificial intelligence to anticipate those shifts with striking precision. In a study published in Theoretical and Applied Climatology, the scientists harnessed seven years of hourly pollution and weather observations from four contrasting urban environments—an industrial zone, a traffic-dominated corridor, a suburban neighbourhood and a peri-urban fringe—to build and test three machine-learning models that forecast fine particulate pollution, or PM2.5, for individual monitoring sites. Their most dependable model, a Random Forest, reproduced observed concentrations with root-mean-square errors as low as 5.96 micrograms per cubic metre, an accuracy the authors describe as suitable for operationally relevant, site-specific forecasts. The work is part of a broader turn in the atmospheric sciences, in which data-driven models are being asked not merely to record a city’s pollution but to see it coming.
PM2.5 refers to airborne particles no wider than 2.5 micrometres—roughly one-thirtieth the diameter of a human hair. That size is precisely what makes the pollutant so dangerous: the particles slip past the filtering defences of the nose and throat, travel deep into the alveoli of the lungs and can even cross into the bloodstream, contributing to heart disease, stroke, chronic respiratory illness and premature death. The stakes are enormous. Recent estimates cited by the authors attribute about 8.1 million deaths worldwide in 2021 to air pollution, roughly 2.1 million of them in India. India’s national standard allows an annual PM2.5 average of 40 micrograms per cubic metre—eight times the World Health Organization’s guideline—and Hyderabad, whose population, construction activity and vehicle fleet have expanded rapidly over the past two decades, has repeatedly pushed beyond that limit despite a substantial municipal clean-air action plan, sharpening the demand for tools that can anticipate dangerous air rather than merely record it.
What separates the new work from much of the existing literature is its deliberate multi-site, multi-model design. Earlier machine-learning efforts in India have often trained a single algorithm on data from a single station, leaving open whether a model captures real atmospheric behaviour or the quirks of one location. The research team—Hampika Gorla, N. Venkatram and Sambasivarao Velivelli of Koneru Lakshmaiah Education Foundation, Gorla and L. V. Narsimha Prasad of the Institute of Aeronautical Engineering in Hyderabad, and G. Ch. Satyanarayana of the National Institute of Disaster Management—instead assembled records from four stations representing sharply different emission profiles and land-use settings. Pollutant measurements came from the Continuous Ambient Air Quality Monitoring network of the Central Pollution Control Board and the Telangana State Pollution Control Board, while meteorological variables such as wind, humidity and boundary-layer height were obtained from the ERA5 global reanalysis produced by the European Centre for Medium-Range Weather Forecasts. The archive spanned 2018 through 2024, giving the algorithms repeated exposure to monsoon, post-monsoon, summer and winter regimes.
Before any modelling, the researchers performed a statistical dissection of the seven-year record, and the results read like a diagnosis of how a monsoon climate shapes urban smog. At all four sites, PM2.5 displayed pronounced diurnal bimodality, surging during the morning rush and again in the evening before easing overnight. That rhythm reflects more than traffic schedules; it tracks the daily breathing of the planetary boundary layer, the lowest kilometre or two of the atmosphere in which pollution mixes. At night, radiative cooling collapses this layer into a shallow veneer, compressing emissions into a small volume of air; after sunrise, surface heating re-inflates it and dilutes the load. Seasonally, the southwest monsoon acted as a reset, with rainfall scavenging particles and vigorous winds flushing the city, while winter and post-monsoon months saw pollutants accumulate under weak winds and shallow mixing. The four records were far from interchangeable: each site’s peaks, lulls and seasonal ceilings bore the stamp of its surrounding land use, so that the combined influence of emission sources, land-use characteristics and atmospheric mixing processes is visible in the raw statistics themselves.
With the climatology established, the team turned to prediction, fielding three algorithms that embody different philosophies of machine learning. The Random Forest, introduced by statistician Leo Breiman in 2001, trains hundreds of decision trees, each on a bootstrapped resample of the data, and restricts each tree to a random subset of candidate predictors at every split; averaging many deliberately decorrelated trees suppresses the overfitting to which a lone tree is prone. The Artificial Neural Network learns instead a continuous nonlinear mapping: input variables such as wind speed, humidity and co-pollutant concentrations pass through layers of artificial neurons that compute weighted sums fed through nonlinear activation functions, with the weights tuned iteratively until prediction error is minimized. The Light Gradient Boosting Machine, or LGBM, builds trees sequentially, each new tree trained to correct the residual errors of its predecessors, an approach whose histogram-based splitting and leaf-wise growth make it exceptionally efficient on large tabular datasets. All three models received carefully preprocessed inputs—missing values imputed, variables normalized—and were judged on withheld test data they had never seen.
The head-to-head evaluation delivered a clear verdict. Across all four sites, the Random Forest proved the most stable and accurate performer, with test root-mean-square errors as low as 5.96 micrograms per cubic metre, coefficients of determination reaching 0.85 and index-of-agreement values exceeding 0.96, on a scale where 1.0 denotes perfect agreement between forecast and observation. A coefficient of determination of 0.85 means the model accounts for 85 percent of the variance in unseen observations—an unusually high figure for an atmospheric quantity as volatile as particulate matter. In practical terms, an error of about six micrograms is modest against the swings of tens of micrograms that Hyderabad’s monitors register between calm and polluted days. The neural network and LGBM were close behind and showed a particular talent for capturing short-term pollution spikes and the transitions between seasons—precisely the episodes that matter most when a warning must reach the public. Just as important, performance held across industrial, traffic, suburban and peri-urban settings, indicating the approach is not hostage to any single location’s emission fingerprint.
Equally revealing was what the models said about why pollution behaves as it does. Correlation and feature-importance analyses converged on a consistent hierarchy of drivers. At the top sat co-emitted gases—carbon monoxide, nitric oxide and sulfur dioxide—which share combustion sources with fine particles and therefore act as real-time fingerprints of emission intensity; when these gases climb, PM2.5 almost always follows. Meteorological variables formed the second tier. Relative humidity favours particle growth and aqueous-phase secondary chemistry, wind speed and direction govern how efficiently pollution is swept away or imported from neighbouring regions, and boundary-layer height sets the volume of air available for dilution. Together, the rankings explain Hyderabad’s pollution calendar: emissions do not swing dramatically from month to month, but the atmosphere’s capacity to disperse them does. A model that ingests both emission proxies and ventilation physics is, in effect, learning the city’s atmospheric plumbing.
The study also confronted a question many operational forecasts quietly avoid: how confident is the model in its own numbers? The researchers quantified predictive uncertainty by constructing prediction intervals—ranges expected to bracket the true concentration a stated fraction of the time—derived from the statistical behaviour of each model’s errors. A forecast that is accurate on average yet unreliable during exactly the stagnation episodes that trigger health warnings is of limited use. Here, too, the Random Forest and LGBM excelled, producing consistently narrow prediction intervals across diverse atmospheric conditions, from monsoon washouts to still winter nights. The authors emphasize that this explicit uncertainty assessment, largely absent from earlier Indian air-quality studies, is what allows a forecast to carry operational weight: a tight interval lets authorities act decisively, while a wide one signals that caution is warranted. Methods of this kind, rooted in classical error analysis and resampling statistics, are increasingly regarded as a prerequisite for machine-learning forecasts with public-safety consequences.
The practical implications reach well beyond the monitoring stations. Site-specific forecasts of this accuracy can feed into traffic management, restricting vehicle flows on days when a spike is anticipated; into anticipatory curbs on industrial emissions ahead of stagnant weather; into seasonal strategies such as construction-dust controls through the dry months; and into public-health advisories timed for schools, outdoor workers and vulnerable groups. The same output can also sharpen the evaluation of whether an intervention—a traffic restriction, a factory shutdown—actually bent the pollution curve. Because the framework relies only on publicly available monitoring data and reanalysis meteorology, the authors argue it is readily transferable to other Indian and global megacities contending with similar combinations of emission growth and unfavourable meteorology. In that sense the study offers less a single result than a template—a multi-site, multi-model, uncertainty-aware pipeline that converts routine air-quality records into actionable foresight, addressing the single-site, single-model limitations that have constrained earlier forecasting efforts.
The work, published on 21 August 2026 as article 588 in volume 157 of Theoretical and Applied Climatology, was carried out without external funding, and its underlying data remain publicly accessible through the national and state pollution control boards. As machine learning settles ever deeper into the earth sciences, the Hyderabad study illustrates a quiet shift in emphasis: away from inscrutable black boxes and toward models whose most influential inputs can be read as physical statements about emissions and ventilation. The same algorithms that learned to anticipate the city’s next pollution peak also mapped, in effect, the atmospheric plumbing that produces it. For the many cities expanding faster than their monitoring infrastructure, that blend of accuracy, interpretability and transferability may prove the research’s most consequential export.
Cite Scienmag News
Russell Cooper. (August 30, 2026). Machine learning forecasts PM2.5 pollution across Hyderabad, revealing weather drivers. Scienmag. https://scienmag.com/machine-learning-forecasts-pm2-5-pollution-across-hyderabad-revealing-weather-drivers/
Russell Cooper. "Machine learning forecasts PM2.5 pollution across Hyderabad, revealing weather drivers." Scienmag, 30 August 2026, https://scienmag.com/machine-learning-forecasts-pm2-5-pollution-across-hyderabad-revealing-weather-drivers/. Accessed 3 September 2026.
Russell Cooper. "Machine learning forecasts PM2.5 pollution across Hyderabad, revealing weather drivers." Scienmag. August 30, 2026. https://scienmag.com/machine-learning-forecasts-pm2-5-pollution-across-hyderabad-revealing-weather-drivers/


