


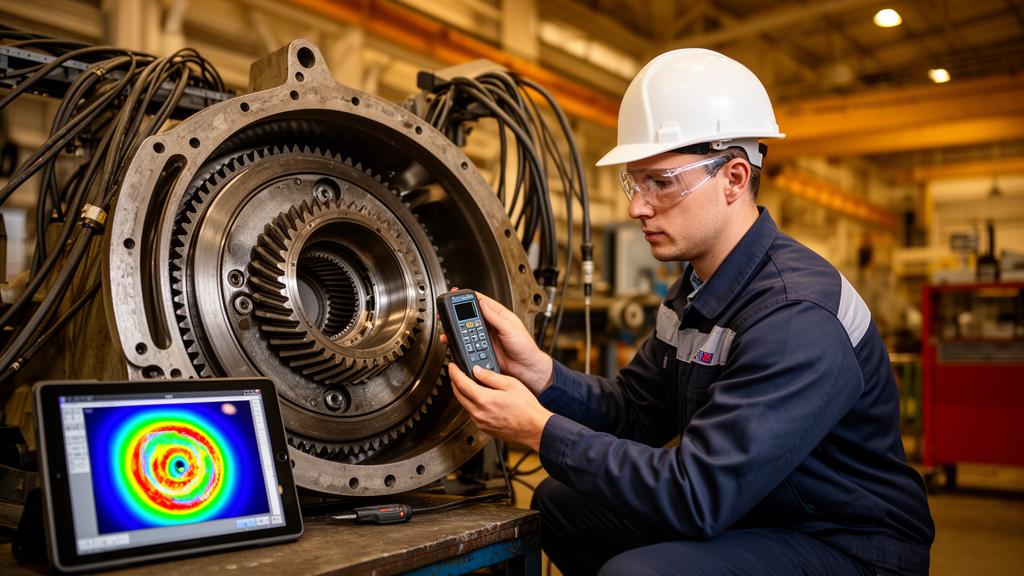
Gearboxes are the workhorses of modern industry, spinning inside wind turbines, electric vehicles, and factory production lines. When something goes wrong, it rarely goes wrong in just one way. A bearing can wear down while a gear tooth cracks, and both problems can hide inside the same vibration signal. Making matters worse, machines rarely run at a single fixed speed. A new study published in Mechanical Sciences by Junwei Shen of the Shanxi Institute of Mechanical and Electrical Engineering in Changzhi, China, tackles this compound fault diagnosis problem with an unexpected tool: network graphs borrowed from the world of machine learning, where vibration data is transformed into simple node-and-edge structures that a computer can read like a map.
The core idea is deceptively simple. Instead of feeding raw vibration waveforms into a deep neural network, the method converts each three-channel recording window into a fixed graph with 30 nodes. Each node carries two kinds of information: full-window spectral statistics that describe the overall frequency content of the signal, and eight local log-power descriptors that capture how energy is distributed across specific frequency bands. The connections between nodes are prescribed in advance rather than learned, which is why the approach is called a fixed channel-frequency graph. A two-layer graph network then processes this structure to predict seven binary fault labels, allowing it to flag multiple simultaneous fault components in a single pass.
What makes this benchmark particularly rigorous is how Shen tested it. The study used 64 publicly available recordings and employed recording-disjoint operating-condition holdouts, meaning the model was evaluated on recordings it had never seen before, at speeds different from its training data. This cross-speed evaluation is critical because a diagnostic system that only works at one rotational speed is of limited practical value. The holdout conditions included 1200, 1800, and 2400 revolutions per minute, as well as variable speed scenarios, ensuring the method had to generalize across changing operating conditions rather than memorize speed-specific patterns.
The results tell a nuanced story. The fixed graph achieved a mean recording-level Macro-F1 score of 0.8284, which translates to roughly 83 percent average accuracy in identifying seven fault types. To put this in context, Shen compared it against two important controls. A matched self-loop control, which strips away the prescribed connectivity and relies only on self-connections, scored 0.7954. A degree-matched random graph, which preserves the same number of connections but places them randomly, scored 0.8150. The fixed graph beat both, suggesting that the prescribed topology genuinely contributes to performance rather than just the presence of any connections at all.
Five-seed condition results reinforced this finding. Across all four holdout conditions, the adaptive graph consistently outperformed the random graph baseline, with differences of 0.0420, 0.0146, 0.0142, and 0.0370 at 1200, 1800, and 2400 revolutions per minute and variable speed, respectively. This consistency across different operating speeds and multiple random initializations suggests the advantage is robust rather than a statistical fluke. The adaptive comparator achieved 0.8420, edging past the fixed graph and indicating that allowing the network to learn its own connectivity can squeeze out additional performance.
However, the study is refreshingly honest about its limits. The fixed graph remained below a waveform convolutional neural network, which achieved 0.9708 on the same benchmark. Even more striking, a validation-gated CNN-graph fusion approach reached 0.9713, showing that combining graph and waveform learning can match or slightly exceed pure waveform approaches. The waveform CNN’s dominance suggests that raw vibration signals contain fine-grained temporal information that the graph representation, with its spectral statistics and local power descriptors, partially discards during the conversion process.
Performance also deteriorated under noise. When test recordings were corrupted with noise at 0 and minus 5 decibels, the graph methods struggled, and validation rotation retained a persistent low-speed deficit. These findings matter because real industrial environments are noisy places, and a diagnostic system that fails under realistic acoustic conditions is of limited use on an actual factory floor. The low-speed deficit is particularly noteworthy, as slow rotational speeds produce fault signatures that are harder to distinguish in the frequency domain, where the graph representation operates.
What does this mean for the future of machinery health monitoring? The study quantifies, for the first time on this benchmark, exactly how much the prescribed topology contributes within a graph representation of vibration data. That contribution is real but modest. Graph methods offer interpretability advantages: because the connectivity is fixed and prescribed, engineers can inspect exactly how information flows between frequency descriptors, something that remains opaque in waveform CNNs. This transparency could prove valuable in safety-critical applications where understanding why a model flagged a fault is as important as the flag itself.
The broader lesson is that no single representation wins everywhere. Graph approaches beat random baselines and demonstrate genuine promise for compound fault diagnosis under changing speeds, yet adaptive connectivity and waveform learning achieve higher overall scores on this particular benchmark. As industrial machines grow more complex and condition monitoring becomes standard practice, hybrid approaches that combine the interpretability of graphs with the raw power of waveform deep learning may offer the best path forward. Shen’s work provides a careful, controlled foundation for that conversation, showing both what graph methods can do for gearbox diagnostics and where they still fall short.
Subject of Research: Fixed Channel Frequency Graphs for Cross Speed Compound Fault Diagnosis of Gearboxes
Article Title: Fixed Channel Frequency Graphs for Cross Speed Compound Fault Diagnosis of Gearboxes
Article References: Shen, J. (2026). Fixed Channel Frequency Graphs for Cross Speed Compound Fault Diagnosis of Gearboxes. https://doi.org/10.5194/ms-2026-186
Image Credits: AI Generated
DOI: 10.5194/ms-2026-186
Keywords: Fixed, Channel, Frequency, Graphs, Cross, Speed, Compound, Fault, Diagnosis, Gearboxes, scientific research
Cite Scienmag News
Blake Davidson. (October 15, 2026). Graph Networks Turn Gearbox Vibrations Into Fault Maps. Scienmag. https://scienmag.com/graph-networks-turn-gearbox-vibrations-into-fault-maps/
Blake Davidson. "Graph Networks Turn Gearbox Vibrations Into Fault Maps." Scienmag, 15 October 2026, https://scienmag.com/graph-networks-turn-gearbox-vibrations-into-fault-maps/. Accessed 15 October 2026.
Blake Davidson. "Graph Networks Turn Gearbox Vibrations Into Fault Maps." Scienmag. October 15, 2026. https://scienmag.com/graph-networks-turn-gearbox-vibrations-into-fault-maps/


