

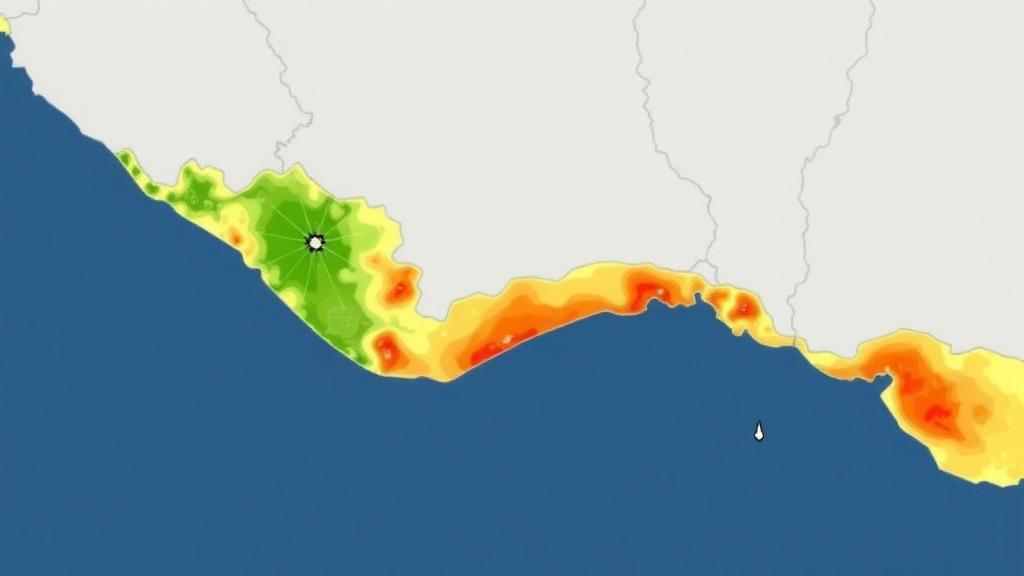
A new open-access study has produced a detailed flood susceptibility map for Alappuzha District, a low-lying coastal plain in the southern Indian state of Kerala, using a geographic information system (GIS) combined with multi-criteria decision analysis (MCDA). The research, published in Discover Hazards, integrates seven physical indicators into a composite Physical Vulnerability Index and validates the resulting map against satellite-derived flood extents from the catastrophic August 2018 Kerala floods.
The study, conducted by Shinov Paitonpatrick and Sajad Nabi Dar, focuses on a district that covers roughly 1,414 square kilometres along the Arabian Sea and is among the flattest terrestrial surfaces in peninsular India. Mean elevation is approximately 3 metres above sea level, about 60 percent of the area lies below 5 metres, and terrain ranges from roughly minus 3 metres in the reclaimed polders of the Kuttanad region to about 90 metres in eastern upland hillocks, a total relief of about 93 metres. Approximately 9 percent of the district, about 127 square kilometres, lies below mean sea level, and roughly 80 percent sits below 10 metres.
The authors built their framework around seven indicators: annual rainfall, elevation, slope gradient, drainage density, land use and land cover, proximity to the river and canal network, and proximity to road infrastructure. Terrain data came from FABDEM v1.2, a 30-metre bare-earth digital terrain model, while rainfall surfaces were interpolated from meteorological station records, land cover was classified from Sentinel-2 imagery at 10-metre resolution, and river and road networks were sourced from OpenStreetMap and Survey of India topographic sheets. Each indicator was reclassified onto a standardised ordinal scale from 1, indicating very low vulnerability, to 5, indicating very high vulnerability.
Instead of relying on a single expert panel, the researchers derived indicator weights by synthesising weighting schemes reported in twelve published flood-susceptibility and related geospatial studies from comparable coastal and deltaic environments. Rainfall received the highest weight at 25 percent, drainage density 20 percent, proximity to rivers and elevation 15 percent each, land use and slope 10 percent each, and distance from roads 5 percent. The weighted layers were then combined through a weighted linear combination to produce the continuous Physical Vulnerability Index, which was classified into five vulnerability classes using Jenks’ natural breaks optimisation.
The resulting map shows extensive high and very high vulnerability zones concentrated in the central and southern floodplains, particularly in Kuttanad, Ambalappuzha, and Cherthala. The combined high and very high classes cover approximately 43.7 percent of the district, around 618 square kilometres, while medium vulnerability zones account for about 26.6 percent, roughly 377 square kilometres, and the low and very low classes together cover about 29.7 percent, approximately 419 square kilometres, largely in the elevated northeastern margins of Chengannur and Mavelikkara taluks. At the taluk level, Cherthala recorded 56 percent high or very high coverage and Kuttanad 60 percent, while Mavelikkara and Chengannur recorded 70 percent low or very low coverage.
A sensitivity analysis tested the robustness of the weighting scheme by perturbing the two highest-ranked indicator weights within a plus or minus 10 percent range across four scenarios. The combined high and very high vulnerability area varied by no more than plus or minus 2.6 percent relative to the baseline of roughly 618 square kilometres, ranging from 604 to 634 square kilometres, and the spatial clustering of the highest-vulnerability zones remained unchanged, suggesting the pattern reflects genuine terrain and hydrological controls rather than artefacts of specific weight choices.
Validation against the 2018 flood event drew on village-level flood extent data for 92 villages derived from Sentinel-1 C-band radar imagery processed through Google Earth Engine, comparing pre-flood imagery from July 2018 with peak-flood imagery from August 15 to 25, 2018. Permanently inundated features such as Vembanad Lake were filtered out using the Global Surface Water dataset, so the inventory documents inundation of typically non-water terrestrial areas. During the peak flood period, approximately 1,390 to 1,400 square kilometres of cumulative village-level inundation were recorded, with more than 95 percent of the mapped terrestrial village area affected on average, reflecting the exceptional severity of the event.
At the taluk level, Spearman’s rank correlation between predicted vulnerability rankings and observed flood extent yielded a value of 0.771, with a p-value of 0.072. The authors note that with only six administrative units, formal statistical significance at the conventional 0.05 level is constrained, but the magnitude of the correlation indicates meaningful agreement. Four of the six taluks, or 67 percent, were classified at exactly the correct vulnerability rank, and the framework correctly identified the two most flood-prone taluks, Cherthala and Kuttanad, which recorded the highest actual flood extents of 327.0 and 304.1 square kilometres respectively, as well as the least flood-prone taluk, Chengannur, at 143.2 square kilometres. Ambalappuzha and Mavelikkara were each off by two ranks, a discrepancy the authors attribute to the pump-drained polder systems and embankments in those areas, which reduce visible standing water in radar imagery and cannot be resolved by regional-scale 30-metre indicator layers. A complementary village-level check found that villages in high or very high vulnerability classes recorded a mean inundated area of 18.4 square kilometres compared with 12.7 square kilometres for villages in moderate to very low classes, with a positive point-biserial association of roughly 0.34.
The indicator analysis also quantified the physical setting in detail. The lowest slope class covers about 49.4 percent of the district, roughly 699 square kilometres, and nearly 68 percent has a slope below 4 degrees. About 56 percent of the district falls within the highest proximity class relative to the mapped river and canal network, and together roughly 78 percent lies within the two highest fluvial-proximity classes. The land cover classification identified built-up land as the largest class at 54.9 percent, followed by agriculture at 21.1 percent and water bodies at 15.3 percent, with forest covering only 4.0 percent. An accuracy assessment using 250 stratified random reference points yielded an overall classification accuracy of 87.6 percent and a Cohen’s Kappa of 0.84, with the lowest user’s accuracy of 78 percent for the built-up class, consistent with known spectral confusion between built-up surfaces, bare reclaimed polders, and high-reflectance coconut canopy in deltaic terrain.
The authors emphasise that the framework addresses physical susceptibility only, deliberately excluding social, economic, demographic, and institutional dimensions of vulnerability, which they identify as priorities for future work alongside hydrodynamic modelling, pixel-level validation metrics, and higher-resolution LiDAR elevation data. They also acknowledge residual vertical uncertainty in the 30-metre terrain model within wetland-dominated and pump-drained reclaimed polders, and inherent subjectivity in the literature-derived weighting scheme. Even so, they argue the approach demonstrates how physically weighted vulnerability frameworks calibrated to compressed-relief coastal plains, where rainfall and drainage density dominate rather than slope and elevation, can support risk-informed land-use regulation, infrastructure planning, and disaster risk reduction in monsoon-dominated tropical lowlands, and may be transferable to other low-gradient deltaic environments globally.
Subject of Research: GIS-based flood susceptibility mapping in the Alappuzha coastal lowland of Kerala, India
Article Title: Flood susceptibility mapping in the Alappuzha Coastal Lowland, Kerala, India using GIS and multi-criteria decision analysis
Article References: Paitonpatrick, S., & Dar, S. N. (2026). Flood susceptibility mapping in the Alappuzha Coastal Lowland, Kerala, India using GIS and multi-criteria decision analysis. Discover Hazards, 2(1), Article 58. https://doi.org/10.1007/s44475-026-00063-y
Image Credits: AI Generated
DOI: 10.1007/s44475-026-00063-y
Keywords: flood susceptibility, GIS, multi-criteria decision analysis, Alappuzha, Kerala, Kuttanad, Sentinel-1 SAR, physical vulnerability index, coastal lowland, 2018 Kerala floods, remote sensing, weighted linear combination
Cite Scienmag News
Violet Maxwell. (October 29, 2026). GIS Model Maps Flood Vulnerability Across Kerala’s Low-Lying Alappuzha Coast. Scienmag. https://scienmag.com/gis-model-maps-flood-vulnerability-across-keralas-low-lying-alappuzha-coast/
Violet Maxwell. "GIS Model Maps Flood Vulnerability Across Kerala’s Low-Lying Alappuzha Coast." Scienmag, 29 October 2026, https://scienmag.com/gis-model-maps-flood-vulnerability-across-keralas-low-lying-alappuzha-coast/. Accessed 4 November 2026.
Violet Maxwell. "GIS Model Maps Flood Vulnerability Across Kerala’s Low-Lying Alappuzha Coast." Scienmag. October 29, 2026. https://scienmag.com/gis-model-maps-flood-vulnerability-across-keralas-low-lying-alappuzha-coast/