


For millions of people with Graves’ disease, the most distressing symptoms often appear not in the thyroid gland itself but in the eyes. Thyroid-associated ophthalmopathy, also known as thyroid eye disease, can push the eyes forward, blur vision, and in severe cases threaten sight. Yet one of the most basic clinical questions remains surprisingly hard to answer with confidence: is the disease currently inflamed and active, or has it burned out into a stable, fibrotic state? That distinction drives every major treatment decision, from immunosuppressive therapy to surgical timing, and clinicians have long relied on a crude bedside checklist known as the Clinical Activity Score to make the call.
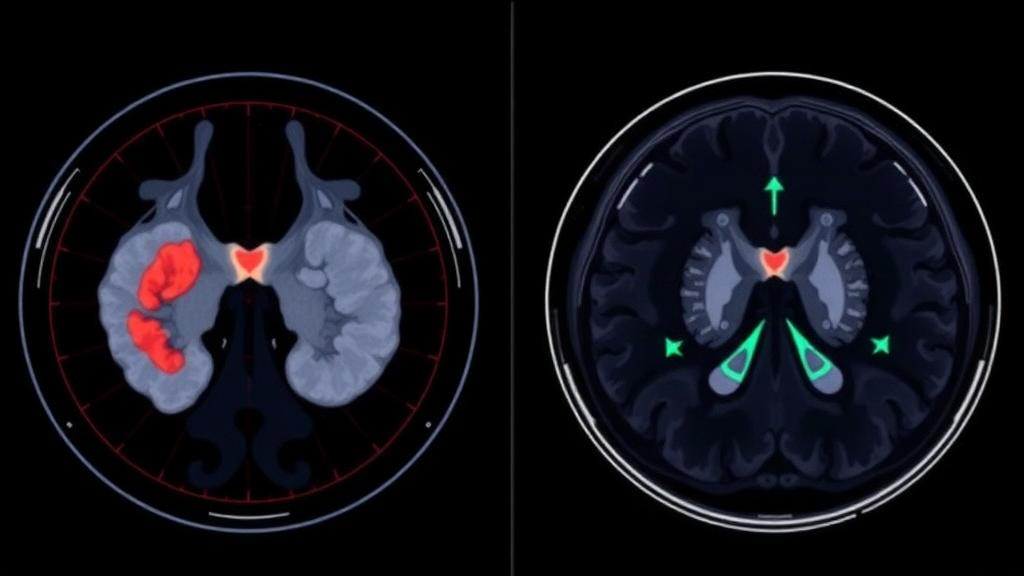
A new study published in the European Journal of Nuclear Medicine and Molecular Imaging suggests that a hybrid imaging technique may finally bring quantitative rigor to this assessment. Researchers at Peking Union Medical College Hospital in Beijing prospectively enrolled 33 patients with thyroid-associated ophthalmopathy and scanned them on an integrated PET/MRI system using a radiotracer called 18F-NOTA-FAPI-04. Unlike conventional FDG, which tracks glucose metabolism in any active cell, FAPI tracers bind to fibroblast activation protein, a molecule displayed by activated fibroblasts and their inflammatory partners. Because thyroid eye disease is fundamentally a fibroinflammatory disorder of the orbital tissues, the tracer offers a way to visualize the cellular machinery driving the disease rather than its downstream anatomical consequences.
The technical logic of the study is worth unpacking. Each patient’s orbits were imaged simultaneously with PET, which quantifies molecular uptake, and with a battery of advanced MRI sequences that probe tissue microstructure. The MRI panel included T2 mapping, which reflects tissue water content and therefore edema; intravoxel incoherent motion diffusion imaging, which separates true water diffusion from blood flow within capillaries; and diffusion kurtosis imaging, which captures deviations from simple Gaussian diffusion and thus hints at tissue complexity. From these sequences the team extracted parametric maps of normalized T2 signal, the heterogeneity index alpha, the distributed diffusion coefficient, the diffusion coefficient, relative blood flow, mean diffusivity, and mean kurtosis. The goal was to see whether the molecular signal from PET and the microstructural signal from MRI tell the same story, and whether combining them outperforms either alone.
Participants were classified using the Clinical Activity Score, with eyes scoring three or higher considered active and those below three considered inactive. At the patient level, a person was labeled inactive only if both eyes were inactive. The researchers then extracted a rich set of quantitative features from each eye: PET metrics including maximum and mean standardized uptake values, metabolic tumor volume, and total lesion FAPI uptake, plus first-order histogram statistics such as mean, skewness, and kurtosis from each MRI parametric map. A support vector machine, a standard machine-learning classifier, was trained to distinguish active from inactive disease, and performance was evaluated with receiver operating characteristic analysis.
Reliability came first, and the numbers were reassuring. Interobserver and intraobserver agreement in delineating the orbital regions of interest was strong, with Dice similarity coefficients of 0.850, 0.880, and 0.901 for the different comparisons. Every quantitative PET and MRI parameter showed excellent reproducibility, with intraclass correlation coefficients above 0.907. In a field where subjective eyeballing of scans has long been the norm, this level of measurement stability matters: it means the features being fed into the classifier are not artifacts of who happened to draw the contours.
The correlation analysis produced one of the study’s most interesting nuances. At the patient level, where both eyes are averaged together, PET and MRI features correlated only weakly. But when each eye was analyzed as its own unit, the correlations strengthened considerably, particularly between PET uptake metrics and features derived from T2 mapping, the heterogeneity index, the diffusion coefficient, and mean diffusivity. This asymmetry makes biological sense. Thyroid eye disease is notoriously asymmetric, with one eye often far more inflamed than the other, and averaging across eyes dilutes the very signals that matter. The finding is a quiet argument for eye-level, rather than patient-level, imaging assessment in orbital disease.
The group comparisons confirmed that several quantitative features separate active from inactive disease. At the eye level, mean standardized uptake value, metabolic tumor volume, and total lesion FAPI uptake were all significantly higher in active eyes, while maximum standardized uptake value alone showed no significant difference, a reminder that peak values are often less informative than volume-weighted averages. On the MRI side, features from T2 mapping, the heterogeneity index, the diffusion coefficient, mean diffusivity, and mean kurtosis also differed significantly between active and inactive groups, consistent with the idea that active disease carries more edema and altered diffusion characteristics than fibrotic, quiescent tissue.
When it came to discriminating activity, the combined approach won. Among single PET parameters, mean standardized uptake value performed best at the patient level with an area under the curve of 0.759, while metabolic tumor volume led at the eye level with an AUC of 0.767. These are respectable but unremarkable figures, in the range of many clinical biomarkers. The combined PET/MRI model, however, pushed performance to an AUC of 0.844 at the patient level and 0.859 at the eye level. The improvement over either modality alone indicates that FAPI uptake and MRI-derived microstructural features carry complementary, not redundant, information about the state of the orbital tissues. In practical terms, the PET signal appears to capture the cellular fibroinflammatory process while the MRI parameters capture its tissue-level consequences, and the classifier benefits from having both.
The clinical implications are significant. Treatment for active thyroid eye disease, including high-dose glucocorticoids and newer targeted agents such as anti-IGF-1 receptor antibodies, works best early in the inflammatory phase and offers little once fibrosis has set in. Conversely, rehabilitative surgeries are best deferred until the disease is inactive. A quantitative imaging biomarker that reliably separates these phases could spare patients from ineffective treatment, reduce exposure to steroid side effects, and help time interventions more precisely. It could also serve as an objective endpoint in clinical trials, where the Clinical Activity Score’s known inter-observer variability has long complicated the interpretation of results. Prior studies have explored FDG-PET and multiparametric MRI separately for this purpose, but the FAPI tracer’s specificity for activated fibroblasts, combined with simultaneous MRI acquisition on a single scanner, represents a meaningful step forward in what the field calls molecular-radiological phenotyping.
Cautions remain, and the authors are candid about them. Thirty-three patients is a small cohort, and the classifier’s performance will need validation in larger, independent, and ideally multi-center populations before it can influence routine care. The Clinical Activity Score itself, used here as the reference standard, is an imperfect ground truth, which means the imaging model is being trained to reproduce a clinical judgment rather than to measure disease biology directly. The study was registered as a clinical trial and conducted under ethics approval at Peking Union Medical College Hospital, and the team notes that further validation is required. Still, the trajectory is clear: a single integrated scan that fuses molecular information about fibroblast activity with quantitative maps of tissue edema, perfusion, and diffusion could transform thyroid eye disease from a condition assessed by counting symptoms into one measured, monitored, and treated on the basis of what is actually happening inside the orbit. For a disease that can quietly steal sight, that kind of clarity cannot come soon enough.
Subject of Research: Quantitative assessment of disease activity in thyroid-associated ophthalmopathy using integrated 18F-NOTA-FAPI-04 PET/MRI
Article Title: Integrated 18F-NOTA-FAPI-04 PET/MRI for quantitative assessment of disease activity in thyroid-associated ophthalmopathy
Article References: Yang, X., Gan, L., Shi, X., Wu, M., Li, E., Zhang, Y., Hao, Z., Huang, Z., Xing, H., Liu, X., & Huo, L. (2026). Integrated 18F-NOTA-FAPI-04 PET/MRI for quantitative assessment of disease activity in thyroid-associated ophthalmopathy. European Journal of Nuclear Medicine and Molecular Imaging. https://doi.org/10.1007/s00259-026-08157-x
Image Credits: AI Generated
DOI: 10.1007/s00259-026-08157-x
Keywords: thyroid-associated ophthalmopathy, thyroid eye disease, PET/MRI, 18F-NOTA-FAPI-04, fibroblast activation protein, Clinical Activity Score, multiparametric MRI, intravoxel incoherent motion, diffusion kurtosis imaging, radiomics, support vector machine, Graves orbitopathy
Cite Scienmag News
Ophelia Keating. (October 3, 2026). Fibrosis-Seeking PET/MRI Scan Offers Sharper Measure of Thyroid Eye Disease Activity. Scienmag. https://scienmag.com/fibrosis-seeking-pet-mri-scan-offers-sharper-measure-of-thyroid-eye-disease-activity/
Ophelia Keating. "Fibrosis-Seeking PET/MRI Scan Offers Sharper Measure of Thyroid Eye Disease Activity." Scienmag, 3 October 2026, https://scienmag.com/fibrosis-seeking-pet-mri-scan-offers-sharper-measure-of-thyroid-eye-disease-activity/. Accessed 4 October 2026.
Ophelia Keating. "Fibrosis-Seeking PET/MRI Scan Offers Sharper Measure of Thyroid Eye Disease Activity." Scienmag. October 3, 2026. https://scienmag.com/fibrosis-seeking-pet-mri-scan-offers-sharper-measure-of-thyroid-eye-disease-activity/


