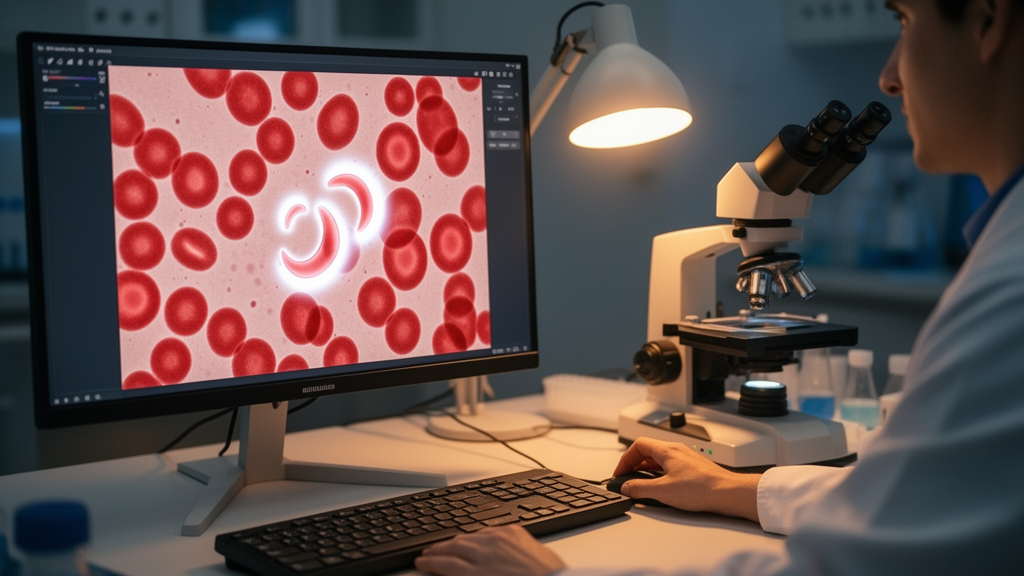
Researchers have built a proof-of-concept pipeline that classifies red blood cell shapes from unstained, label-free brightfield microscope images and then explains, feature by feature, why the artificial intelligence reached each decision. The study, published open access in Discover Artificial Intelligence on 27 October 2026, was designed to close a persistent gap in AI-assisted hematology: models can classify cells accurately, but clinicians rarely receive outputs they can interpret or trust. The team, led by Subalakshmi Ramprasad and Ramesh Babu M. G., reports that a random forest classifier reached an F1 score of 0.89 across ten morphology classes, and that SHAP analysis showed the model relied primarily on light-intensity features rather than the shape descriptors one might intuitively expect from a morphology task.
The dataset was assembled as a multicentric validation effort. Label-free red blood cell images were captured on three different brightfield microscopes—a Motic 2.0, an Olympus BX43, and a Nikon Eclipse Ni-L—each fitted with a 100X oil immersion objective. Blood samples came from five healthy volunteers, collected by finger prick under sterile conditions after informed consent, with ethical approval from the Institutional Ethics Committee of Kasturba Medical College and Kasturba Hospital, Manipal Academy of Higher Education. To generate the full range of cell shapes, the researchers mixed 0.8 microliters of whole blood on a glass slide with 1.2 microliters of in vitro chemical stressors, including Dacie’s fluid and isotonic, hypotonic, and hypertonic NaCl solutions, before covering the sample with a coverslip and imaging it directly.
Four imaging components structured the data collection. The first captured the normal biconcave discocyte shape. The second documented the morphological transitions between discocytes, spherocytes, and echinocytes. The third deliberately recorded technical variants and artifacts of brightfield imaging, such as partial cells, folded cells, overlapping cells, and imaging artifacts. The fourth targeted clinically relevant but rare morphologies, including knizocytes and codocytes, induced by in vitro stressors. Together these components yielded 17,781 single-cell images spanning ten morphology classes, each manually annotated according to a protocol developed by three hematology experts and based on the Bessis classification system, which the authors note maps directly onto biophysical shape change and suits label-free images better than the staining-oriented ICSH and ISLH terminologies.
Segmentation and feature extraction were performed with the RedTell tool, which uses a Mask R-CNN deep learning model to isolate individual cells. From each segmented cell, 74 morphometric features were extracted: 14 shape descriptors such as area, axis lengths, aspect ratio, and eccentricity; 18 intensity-based statistical features such as mean intensity, standard deviation, skewness, and kurtosis; and 42 texture features derived from gray-level co-occurrence, dependence, run-length, and size-zone matrices. Shape features describe cell geometry, while intensity and texture features capture how cells interact with the white light of the microscope. Before any classifier training, the team screened the features with principal component analysis to detect acquisition-related anomalies and cross-referenced outlier clusters against acquisition metadata.
Seven machine learning classifiers were then compared under consistent conditions: random forest, gradient boosting, extra trees, support vector machine, k-nearest neighbors, logistic regression, and a multi-layer perceptron. Class-weighted learning addressed class imbalance, and all models were evaluated with 5-fold stratified cross-validation on the training set, which held 75 percent of the cell-level data, with the remaining 25 percent reserved for testing. The random forest classifier achieved the highest test accuracy of 0.8985 and an F1 score of 0.8910 without feature selection. When the top 25 percent of features, chosen by mutual information, were used instead, accuracy rose to 0.9454 and F1 to 0.9430—but group-wise analysis revealed a consistent reduction in F1 scores for several morphological groups, particularly rare classes. The full 74-feature model was therefore retained for all downstream explainability work.
Performance was strongly uneven across classes. Well-represented groups such as severe echinocytes (F1 = 0.97), spherocytes (F1 = 0.96), and early echinocytes (F1 = 0.89) were classified reliably, while rare groups struggled. Confusion matrix analysis showed that each rare class was predominantly misclassified as discocytes rather than producing random errors: 57.1 percent of folded-cell errors, 54.9 percent of codocyte errors, 31.5 percent of overlapping-cell errors, and 27.7 percent of knizocyte errors landed on the discocyte label, with artifacts most often confused with partial cells at 33.3 percent. The authors interpret this as evidence that the rare classes represent subtle morphological deviations from the discocyte baseline rather than distinct, easily separable forms.
A central methodological concern was whether intensity features reflected genuine cell biology or merely device-specific acquisition differences. Leave-one-microscope-out cross-validation, restricted to the eight classes present across all three microscopes, showed held-out accuracy ranging from 72.4 to 96.5 percent, with a mean of 85.4 percent, depending on which microscope was withheld. When all classes were pooled and colored by microscope identity, principal component analysis of intensity features showed no meaningful device-driven clustering, with a silhouette score of −0.09, and mean intensity values across the three instruments (84.2, 104.2, and 94.6) overlapped substantially despite being numerically distinct. In contrast, when the analysis was restricted to discocytes and severe echinocytes—classes expected to differ biologically in intensity—the separation was strong (silhouette 0.54–0.59) and, critically, was preserved independently within each of the three microscopes (per-microscope silhouette 0.49–0.88), while microscope identity itself showed no separable clustering within this class pair (silhouette ~0.02).
Feature-family comparisons reinforced this interpretation. For the discocyte-versus-severe-echinocyte contrast, intensity features achieved the strongest class separation (silhouette 0.59), exceeding shape features (0.46) and texture features (0.25). The authors argue this indicates that intensity-based discrimination most plausibly reflects genuine, device-independent biological variation—differences in hemoglobin concentration and membrane condensation accompanying the discocyte-to-echinocyte transition—rather than confounding from the multicentric acquisition design, supporting the validity of pooling data across the three microscopes for classifier training.
The explainability results themselves were striking. SHAP analysis of the full-feature random forest model revealed that intensity-based features drove the primary classification decisions, followed by shape features and, to a lesser extent, texture features. The two most influential predictors were bf_intensity_TotalEnergy (mean SHAP ~0.0112) and bf_intensity_Energy (~0.0099), with additional high-ranking intensity measures including the 90th percentile, maximum, mean absolute deviation, and variance (mean SHAP ~0.007–0.009). Shape metrics such as extent, bounding-box area, sphericity, solidity, diameter, and perimeter-to-surface ratio contributed at mean SHAP values of roughly 0.004–0.007, while texture features such as run entropy and gray-level co-occurrence measures contributed at 0.003–0.006. The authors note this hierarchy contradicts the classical hematology intuition that morphology means shape, and attribute it to the physics of label-free brightfield imaging, where contrast arises primarily from transmitted light intensity governed by intracellular hemoglobin, an abundant endogenous chromophore.
Local SHAP analysis across the four imaging components traced how feature importance shifted with morphology. Discocyte classification relied on intensity energy features and the perimeter-to-surface ratio, consistent with the smooth biconcave disc. Early echinocyte formation shifted importance toward localized intensity peaks, consistent with early membrane strain preceding visible spicule formation; severe echinocytes showed increased intensity variance and texture disorder, reflecting chaotic light scattering from multiple spicules; and terminal spherocytes were dominated by heterogeneity metrics and reduced shape extent, consistent with spherical collapse and loss of biconcavity. Technical and quality-control categories relied predominantly on shape-irregularity features rather than intensity, though the authors caution that, given their limited sample sizes, SHAP interpretations for these categories and for the rare knizocytes and codocytes are preliminary and hypothesis-generating pending validation on larger datasets.
Reliability was assessed through confidence calibration on the held-out test partition. The trained random forest showed reasonable overall calibration with an expected calibration error of 0.050, tracking empirical accuracy closely in high-confidence bins—at confidence of 0.85 or above, accuracy ranged from 96.1 to 99.6 percent—while showing moderate overconfidence in lower-confidence bins. A reject-option analysis quantified the trade-off: a confidence threshold of 0.70 or above retained 78.6 percent of cells at 98.2 percent accuracy, while a threshold of 0.90 or above retained 59.9 percent at 99.6 percent accuracy. Per-class analysis found that mean prediction confidence correlated strongly with both training sample size (r = 0.86) and classification accuracy (r = 0.94), with clinically meaningful morphology classes showing higher confidence (0.51–0.94) and accuracy (0.52–0.98) than the sparsely sampled technical categories (confidence 0.45–0.47; accuracy 0.07–0.32).
The authors frame these results as proof of concept rather than a clinically validated diagnostic tool. They acknowledge that the train/test split was performed at the cell level rather than the donor level, that only five donors contributed to the dataset, and that confidence calibration is confounded by small class sample sizes for some groups. They recommend donor-stratified validation with a multidonor cohort as a priority for future translational work, alongside benchmarking of alternative segmentation and classification approaches, compatibility testing with hospital laboratory information systems—which was not evaluated here—and expansion of the rare-class datasets. Within those limits, the study demonstrates that a low-cost, widely available brightfield microscope, combined with automated segmentation, machine learning classification, feature-level explanation, and calibrated confidence scores, can form a single evaluated workflow that links AI predictions to biophysical mechanisms and flags low-confidence predictions for human review, an approach the authors suggest could suit cost-sensitive and resource-limited healthcare settings.
Subject of Research: Explainable machine learning for label-free red blood cell morphology classification using brightfield microscopy images
Article Title: Explainable artificial intelligence for label-free red blood cell morphometrics using brightfield microscopy towards clinical applications
Article References: Ramprasad, S., Jacob, S. S., Baby, P. M., E, S., & M. G., R. B. (2026). Explainable artificial intelligence for label-free red blood cell morphometrics using brightfield microscopy towards clinical applications. Discover Artificial Intelligence, 6(1), Article 1655. https://doi.org/10.1007/s44163-026-02579-0
Image Credits: AI Generated
DOI: 10.1007/s44163-026-02579-0
Keywords: explainable AI, red blood cells, brightfield microscopy, morphometrics, random forest, SHAP, label-free imaging, confidence calibration, hematology, Mask R-CNN, machine learning, clinical translation
Cite Scienmag News
Ophelia Keating. (October 28, 2026). Explainable AI reads red blood cell shapes from plain brightfield microscope images. Scienmag. https://scienmag.com/explainable-ai-reads-red-blood-cell-shapes-from-plain-brightfield-microscope-images/
Ophelia Keating. "Explainable AI reads red blood cell shapes from plain brightfield microscope images." Scienmag, 28 October 2026, https://scienmag.com/explainable-ai-reads-red-blood-cell-shapes-from-plain-brightfield-microscope-images/. Accessed 29 October 2026.
Ophelia Keating. "Explainable AI reads red blood cell shapes from plain brightfield microscope images." Scienmag. October 28, 2026. https://scienmag.com/explainable-ai-reads-red-blood-cell-shapes-from-plain-brightfield-microscope-images/