


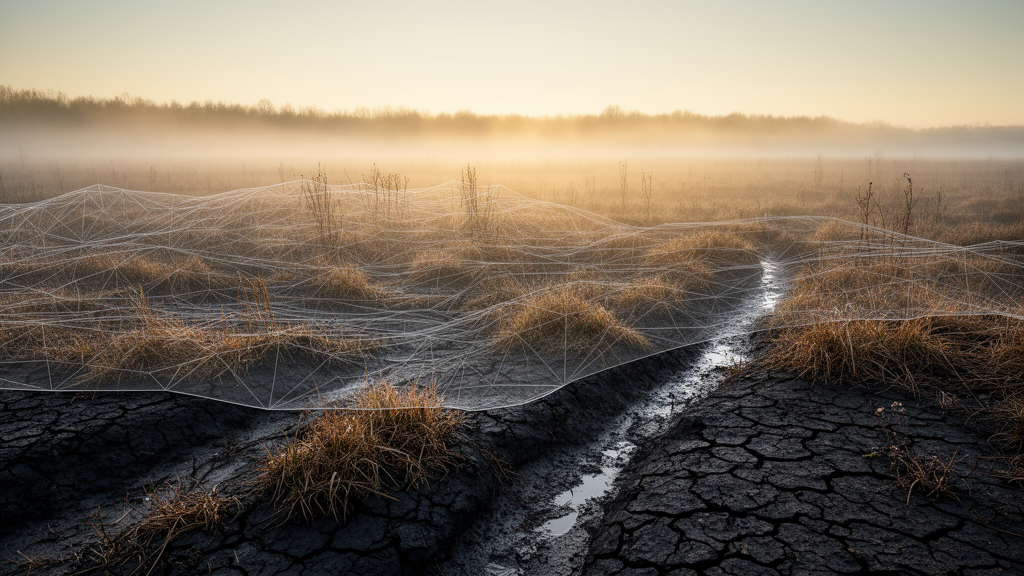
Beneath the grasslands of Brandenburg in northeastern Germany lies a quiet climate problem. More than 90 percent of Germany’s peatlands have been drained for agriculture, and over 95 percent are now considered degraded. What were once among the planet’s most efficient carbon vaults have become chimneys: drained German peatlands release an estimated 53 million tons of CO2-equivalents every year, roughly 7 percent of the country’s total anthropogenic emissions. Restoring these ecosystems by rewetting them has become a central goal of environmental policy, but rewetting a fen is not simply a matter of letting water back in. It requires knowing, with quantitative precision, where every drop of water goes. A new study published in Hydrology and Earth System Sciences provides exactly that, by building one of the most complete digital replicas of a degraded fen ever attempted.
A research team led by Nariman Mahmoodi of the Leibniz Centre for Agricultural Landscape Research (ZALF) spent nearly a decade measuring an 11.6-hectare fen near Paulinenaue, Brandenburg, and then reconstructed it inside a fully coupled three-dimensional surface–subsurface hydrological model called HydroGeoSphere. Unlike conventional models that treat surface water and groundwater separately, HydroGeoSphere simultaneously solves the three-dimensional Richards equation for variably saturated subsurface flow and the diffusion-wave approximation of the Saint-Venant equations for overland flow. That means infiltration, evapotranspiration, groundwater flow, and exchanges with the drainage ditches are all computed together, in a single self-consistent framework. The result is less a simulation than a working hydraulic twin of the peatland itself.
The fidelity of that twin rests on an unusually rich observational foundation. Since 2014, an eddy covariance tower has stood at the center of the site, measuring land–atmosphere exchanges of water vapor at 10 Hz with an open-path CO2/H2O analyser, while a four-component radiation sensor and soil heat flux plates closed the surface energy budget. Groundwater levels inside and outside the site have been recorded daily since 2015, and ditch water levels, controlled by small weirs, served as hydraulic boundary conditions. Crucially, the team also measured leaf area index in the field across eight distinct management units between 2015 and 2020, capturing how mowing and grazing schedules shape the canopy. Field-measured vegetation data of this kind are rarely integrated into fully coupled hydrological models, and the researchers argue this is what gives their simulation its realism.
The peat itself was represented as two contrasting layers, and this vertical split proved decisive. The upper 30 centimeters of peat, compacted and strongly decomposed by decades of drainage, was assigned a porosity of 0.70 and low saturated hydraulic conductivity, with a steep van Genuchten retention parameter that lets it desaturate rapidly when the water table drops. Beneath it lies 70 centimeters of less degraded, fibrous peat with higher porosity (0.80) and much greater horizontal conductivity, which buffers water losses and sustains groundwater levels during drought. The layers rest on roughly 10 meters of medium to coarse sand connected to a regional aquifer, with glacial till and clay lenses forming the impermeable base. Ignoring this heterogeneity, the authors note, causes models to overestimate surface water storage and dampen the sharp water-table rebounds that drained peatlands actually show after rainfall.
Evapotranspiration was parameterized using the Kristensen–Jensen framework, tuned to a distinctive physiological trait of fen grasses: they can keep transpiring even when the soil is nearly saturated. Standard hydrological models typically shut down transpiration under such wet conditions, but the Paulinenaue observations showed the opposite. In the wet summer of 2017, when the water table rose above the peat surface and large parts of the site flooded, transpiration continued. The model’s reduction functions allowed vegetation to remain active between an oxic and an anoxic saturation limit, reproducing this behavior. Transpiration dominated the growing season at 80 to 100 millimeters per month in midsummer, while evaporation from soil and canopy contributed smaller pulses of 5 to 30 millimeters after rainfall and during cooler months.
The model’s performance metrics are striking for a system this complex. Simulated evapotranspiration matched eddy covariance measurements with a root mean square error of 64 millimeters per year, 10.2 millimeters per month, and about 1 millimeter per day, with a Nash–Sutcliffe efficiency of 0.91 at the monthly scale. Groundwater levels were reproduced with Nash–Sutcliffe efficiencies of 0.83 during calibration (2016–2020) and 0.86 during validation (2021–2023), with errors of only 0.15 meters. The model even captured the seasonal inversion of hydraulic gradients: in summer, evapotranspiration draws the peatland water table below the ditch level, so water flows from the ditches and aquifer into the site; in winter, the gradient reverses and the fen drains outward. It also correctly simulated surface inundation events in 2017, 2022, and 2023, tracking the spread and retreat of floodwater across the site.
The water balance that emerges from the simulation tells a story of a system living on a knife edge. Annual precipitation during the study period swung from just 299 millimeters in the extreme drought year 2018 to 640 millimeters in the wet year 2017, while potential evapotranspiration averaged around 710 millimeters per year and peaked at 829 millimeters in 2018. Evapotranspiration was the dominant loss term in every year, and only in the wettest years did precipitation come close to matching it. Storage changes swung between gains of up to 100 millimeters per month during wet summers and losses of 60 to 120 millimeters per month during dry ones. Consecutive drought years from 2016 through 2019 produced cumulative deficits, progressive drying of the peat profile, and the deepest water tables of the record.
One of the most revealing findings concerns human water management. After the heavy rains of June and July 2017 left the region inundated for months, the water authority lowered the level of the main drainage channel, the Großer Havelländischer Hauptkanal. The model faithfully registered the consequence: a pronounced negative storage change the following February and a regional decline in groundwater levels. The episode demonstrates how tightly these fens are coupled to engineered drainage infrastructure, and how management decisions made kilometers away ripple through the peat profile. It also underscores the sensitivity of the simulations to ditch boundary conditions; where ditch data had to be interpolated, such as in the summers of 2018 and 2021, model accuracy degraded.
For restoration practitioners, the implications are sobering. The study shows that simply raising ditch water levels may not be enough to counterbalance rising evaporative demand under a warming climate, because the degraded surface peat, with its reduced porosity and specific yield, amplifies seasonal drying and limits the system’s capacity to retain water. Effective rewetting, the authors conclude, will require measures that reduce drainage losses and enhance local water retention, particularly during periods of high atmospheric demand, while maintaining sufficient water availability across the wider catchment. The validated model now provides the hydrological baseline against which future rewetting scenarios can be tested before a single ditch is blocked. The team also acknowledges limitations: the evapotranspiration formulation saturates transpiration at moderate canopy densities, drought-stress representation could be improved, and scaling the computationally demanding approach to whole regions remains a challenge, though hybrid frameworks combining physics-based simulation with machine learning may extend its reach across Europe’s degraded peatland landscapes.
Subject of Research: Coupled surface–subsurface hydrological modelling of a degraded fen peatland to quantify water-balance dynamics and support rewetting strategies
Article Title: Integrating coupled surface–subsurface modelling and field measurements in a degraded fen: water-balance dynamics and a framework for evaluating rewetting measures
Article References: Mahmoodi, N., Merz, C., Pickert, J., & Dietrich, O. (2026). Integrating coupled surface–subsurface modelling and field measurements in a degraded fen: water-balance dynamics and a framework for evaluating rewetting measures. Hydrology and Earth System Sciences, 30(18), 6019-6037. https://doi.org/10.5194/hess-30-6019-2026
Image Credits: AI Generated
DOI: 10.5194/hess-30-6019-2026
Keywords: peatland hydrology, fen rewetting, HydroGeoSphere, evapotranspiration, groundwater modelling, eddy covariance, peat degradation, water balance, Brandenburg, climate drought, ditch drainage, carbon emissions
Cite Scienmag News
Violet Maxwell. (October 9, 2026). Digital Twin of a Drained Fen Reveals Why Peatland Rewetting Is Harder Than It Looks. Scienmag. https://scienmag.com/digital-twin-of-a-drained-fen-reveals-why-peatland-rewetting-is-harder-than-it-looks/
Violet Maxwell. "Digital Twin of a Drained Fen Reveals Why Peatland Rewetting Is Harder Than It Looks." Scienmag, 9 October 2026, https://scienmag.com/digital-twin-of-a-drained-fen-reveals-why-peatland-rewetting-is-harder-than-it-looks/. Accessed 9 October 2026.
Violet Maxwell. "Digital Twin of a Drained Fen Reveals Why Peatland Rewetting Is Harder Than It Looks." Scienmag. October 9, 2026. https://scienmag.com/digital-twin-of-a-drained-fen-reveals-why-peatland-rewetting-is-harder-than-it-looks/


