


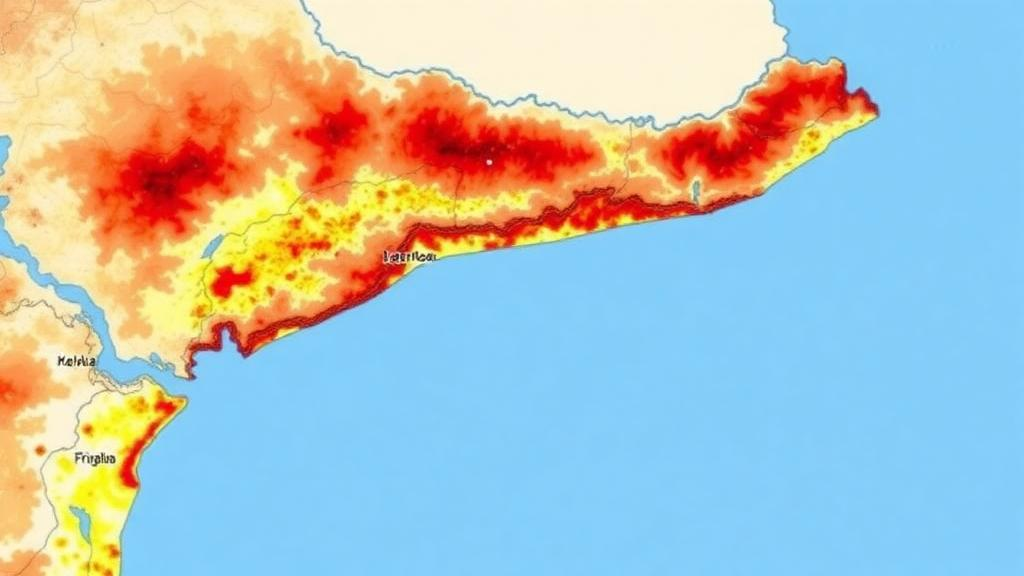
A new way of measuring how exposed coastlines are to flooding and disaster has produced one of the most detailed vulnerability maps yet of the Indian state of Kerala, and the results point to a handful of places where the risk is greatest. Researchers at the National Institute of Technology Calicut have built an integrated Coastal Vulnerability Index that combines geology, ocean physics and human economics into a single probabilistic score, using a statistical tool known as a copula to capture the tangled, nonlinear relationships among the factors that decide whether a coast survives a storm or drowns under one. Writing in the journal Natural Hazards, S. Renu, S. K. Pramada and R. Arunkumar report that the coastal taluks of Ambalappuzha, Kochi and Karunagapalli emerge as the most vulnerable stretches of the Kerala shoreline, a finding validated against the documented inundation pattern of the 2004 Indian Ocean tsunami.
Coastal vulnerability indices have been around since the early 1990s, when researchers first tried to condense the many ingredients of coastal risk into a single number that planners could act on. The classic recipe is deceptively simple: measure a set of variables, such as shoreline erosion rate, coastal slope, tidal range, wave height, sea level rise and population density, rescale them all to a common range, weight them, and add or multiply them together. The result is a map that flags which segments of coastline deserve the most urgent attention. But the traditional approach carries a well-known weakness. It treats every indicator as if it behaved independently, when in reality the factors that drive coastal disaster are deeply intertwined. A gently sloping shore amplifies storm surge, which in turn erodes beaches, which removes the natural buffer protecting dense settlements behind them. Adding or multiplying numbers cannot represent that chain of dependency.
The Kerala team’s answer is to move from deterministic arithmetic to probabilistic statistics. Their framework begins by organizing the drivers of vulnerability into three components: coastal characteristics, which cover the geological and geomorphological makeup of the shore; coastal forces, which capture the physical energy acting on it, from waves and tides to sea level rise; and socioeconomic conditions, which describe the people and infrastructure exposed to harm. Each component is first processed separately, and then the three resulting sub-indices are combined in three different ways. Two of them, an additive index and a multiplicative index, follow the conventional deterministic route. The third, the probabilistic index, uses a copula, a mathematical construct that models the joint probability distribution of several variables while allowing each to keep its own individual distribution and allowing the dependencies among them to be nonlinear and asymmetric.
Copulas have become a workhorse of modern hydrology and risk analysis precisely because they separate the question of how a variable behaves on its own from the question of how it moves together with other variables. In the Kerala application, the copula-based index effectively asks how likely it is that a given taluk simultaneously experiences adverse geological conditions, adverse physical forcing and adverse socioeconomic exposure, rather than simply averaging the three. The distinction matters because extremes cluster. A place with fragile geology is often also a place where the physical forces are harshest, and where the population has the least capacity to absorb a loss. A deterministic average can dilute that coincidence; a probabilistic joint model preserves and quantifies it.
Before any of that aggregation could happen, the raw data had to be made comparable. The indicators in the study come from wildly different sources and scales: satellite-derived sea level measurements, bathymetric grids, geomorphological maps, land use classifications, population density rasters and infrastructure datasets. The researchers used fuzzy logic-based normalization to transform every criterion value onto a common scale, an approach that handles the vagueness inherent in terms like high vulnerability better than a simple linear rescaling. The weights, which determine how much each indicator counts in the final score, were then assigned objectively using the entropy method, which derives weights from the spatial variability of the data itself. Indicators that vary sharply from place to place, and therefore carry more information for discriminating between locations, receive higher weights, while indicators that are nearly uniform along the coast receive lower ones. This removes a layer of subjective judgment that has long troubled vulnerability mapping.
From the weighted, normalized indicators the team computed three component indices: a Geological Vulnerability Index, a Physical Vulnerability Index and a Socio-Economic Vulnerability Index. Each taluk along the Kerala coast received a score on all three, and the three were then fused into the additive, multiplicative and probabilistic versions of the overall index. The comparison among the three aggregation schemes is one of the most instructive parts of the study, because it shows how much the choice of mathematics changes the map. The additive and multiplicative indices, built on deterministic assumptions, produce one ranking of vulnerable places. The probabilistic index, which lets the components interact statistically, produces another, and the differences are not cosmetic. They shift which communities appear at the top of the priority list.
The decisive test came from history. On 26 December 2004, the Indian Ocean tsunami struck the Kerala coast, and the pattern of inundation it left behind has been documented in detail by earlier coastal scientists. If a vulnerability index is doing its job, the places it flags as most vulnerable should broadly match the places the tsunami actually flooded most severely. When the researchers checked their three indices against the tsunami’s coastal impacts, the copula-based probabilistic index matched the observed pattern most faithfully. By accounting for the nonlinear dependencies among geological, physical and socioeconomic factors, it produced a more realistic representation of which stretches of coast were genuinely at risk, outperforming the deterministic alternatives that the field has relied on for decades.
The geographic findings carry immediate weight for Kerala, a densely populated state whose coastline is lined with fishing communities, backwater ecosystems, ports and a tourism economy that depends on the sea. The identification of Ambalappuzha, Kochi and Karunagapalli as the most vulnerable taluks gives the Kerala State Disaster Management Authority and local planners a spatially explicit priority list. Kochi, the state’s commercial hub, combines low-lying terrain and heavy infrastructure exposure with the hydrodynamic setting of a major estuary. Ambalappuzha and Karunagapalli sit on low coastal plains where modest elevations meet energetic wave and tidal forcing and dense rural settlement. The authors frame the framework as providing critical spatial intelligence for enhancing coastal disaster preparedness, adaptive planning and evidence-based policy formulation, and they emphasize that the method is transferable: any coastline with the requisite data can be scored the same way.
The broader significance of the work lies in what it says about how risk science is evolving. Vulnerability assessment began as an exercise in expert judgment and simple arithmetic, and it is now absorbing the machinery of modern statistics and machine learning, from fuzzy normalization and entropy weighting to copula-based joint probability modeling. As climate change accelerates sea level rise and intensifies storm surges, the cost of misranking a coastline grows. A map that understates the joint probability of fragile geology, fierce physical forcing and dense vulnerable populations can steer seawalls, early warning systems and evacuation planning to the wrong places. The Kerala study suggests that probabilistic aggregation is not a statistical nicety but a practical improvement in where the money and attention should go.
There are, of course, limits that the authors themselves acknowledge in the structure of the work. The index is a snapshot built from present-day data, and its accuracy depends on the quality and currency of the underlying datasets, from satellite altimetry to census-derived population grids. The entropy weighting, though objective in derivation, reflects the spatial variability of the study region and would need recalibration elsewhere. Yet the validation against the 2004 tsunami gives the framework an empirical anchor that many vulnerability studies lack, and the fact that the probabilistic version outperformed its deterministic siblings makes a clear case for the approach. For the fishing families living within meters of the high tide line on the Kerala coast, and for the millions more who inhabit low-lying deltas around the world, the message is that the mathematics of vulnerability is finally catching up with the physics and the human geography of the places most likely to flood first.
Subject of Research: A copula-based probabilistic coastal vulnerability index applied to the Kerala coast, India
Article Title: An integrated coastal vulnerability index using a copula-based approach: a case study of Kerala, India
Article References: Renu, S., Pramada, S. K., & Arunkumar, R. (2026). An integrated coastal vulnerability index using a copula-based approach: a case study of Kerala, India. Natural Hazards, 122(20), Article 652. https://doi.org/10.1007/s11069-026-08418-w
Image Credits: AI Generated
DOI: 10.1007/s11069-026-08418-w
Keywords: coastal vulnerability index, copula, Kerala, sea level rise, fuzzy normalization, entropy weighting, tsunami validation, natural hazards, disaster preparedness, multi-hazard assessment, coastal management, India
Cite Scienmag News
Violet Maxwell. (October 1, 2026). Copula-Based Index Reveals Kerala’s Most Vulnerable Coastal Zones. Scienmag. https://scienmag.com/copula-based-index-reveals-keralas-most-vulnerable-coastal-zones/
Violet Maxwell. "Copula-Based Index Reveals Kerala’s Most Vulnerable Coastal Zones." Scienmag, 1 October 2026, https://scienmag.com/copula-based-index-reveals-keralas-most-vulnerable-coastal-zones/. Accessed 16 October 2026.
Violet Maxwell. "Copula-Based Index Reveals Kerala’s Most Vulnerable Coastal Zones." Scienmag. October 1, 2026. https://scienmag.com/copula-based-index-reveals-keralas-most-vulnerable-coastal-zones/


