


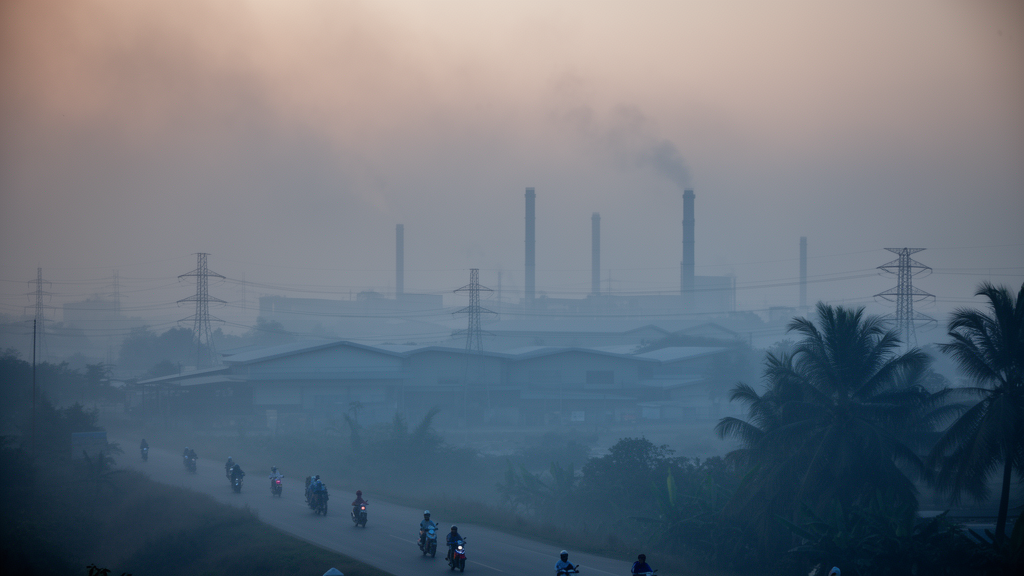
Particulate air pollution in an industrial-suburban district of eastern Thailand follows a strikingly predictable annual rhythm, peaking sharply during the cool season and falling to its lowest levels during the monsoon rains, according to a five-year analysis of monitoring data from Chonburi Province. The study, published in Environmental Challenges, examined daily measurements of fine particulate matter (PM2.5) and coarse particulate matter (PM10) recorded between January 2019 and December 2023 at an official air-quality monitoring station in Bo Win Subdistrict, Si Racha District, an area within Thailand’s fast-developing Eastern Economic Corridor where industrial estates, transport corridors, commercial activity and expanding residential communities coexist.
The retrospective ecological study drew on routinely collected ambient monitoring data from the Pollution Control Department of Thailand, together with meteorological observations from the Thai Meteorological Department. Concentrations were measured continuously as 24-hour averages in micrograms per cubic metre, and the researchers aggregated the daily records into monthly, seasonal and annual means using the Thai climatological classification of summer (March to May), the rainy season (June to October) and the cool season (November to February). Because the analysis relied on a single fixed monitoring station and on publicly available environmental data, it involved no human participants and required no individual-level personal or medical information.
The seasonal signal was unambiguous. Mean PM2.5 concentrations reached 30.13 ± 3.19 micrograms per cubic metre during the cool season, compared with 17.89 ± 2.80 in summer and 14.85 ± 4.28 in the rainy season. PM10 followed the same ordering, averaging 68.60 ± 5.41 micrograms per cubic metre in the cool season, 44.00 ± 2.45 in summer and 38.92 ± 7.54 in the rainy season. One-way analysis of variance showed that the seasonal differences were statistically significant for both pollutants, and post-hoc testing confirmed that cool-season concentrations exceeded both summer and rainy-season values, while summer and the rainy season did not differ significantly from each other. Relative to the cool season, mean PM2.5 fell by roughly 40.6 percent in summer and 50.7 percent in the rainy season, with corresponding declines of 35.9 percent and 43.3 percent for PM10.
Monthly averages revealed the same cycle in finer detail. PM2.5 peaked in January at 34.13 ± 6.01 micrograms per cubic metre, followed by February at 31.45 ± 6.48 and December at 24.76 ± 4.57, and dropped to its lowest levels in August (10.81 ± 2.25), July (10.90 ± 1.23) and June (11.24 ± 1.77). PM10 mirrored the pattern, with the highest monthly means in January (72.98 ± 13.73), February (67.87 ± 11.26) and December (62.75 ± 12.71). On individual days, PM2.5 occasionally exceeded 60 micrograms per cubic metre and PM10 exceeded 150 micrograms per cubic metre during pollution episodes. Notably, both annual and seasonal mean concentrations exceeded the World Health Organization air quality guidelines of 5 micrograms per cubic metre for PM2.5 and 15 micrograms per cubic metre for PM10, indicating that particulate pollution remained a persistent concern throughout the study period, particularly during the cool season.
The composition of the particulate load also shifted with the seasons. The PM2.5/PM10 ratio, an indicator of the relative contribution of fine particles to total particulate mass, ranged from 0.30 to 0.48 across months. It was highest in April (0.48), January (0.47) and February (0.46), and lowest in July (0.30), August (0.32) and June (0.33). Seasonal means were 0.4496 in the cool season, 0.4417 in summer and 0.3382 in the rainy season, with the rainy-season ratio significantly lower than both other seasons. The authors interpret this as a shift toward a greater relative contribution of coarse particles, such as resuspended road and soil dust, during the wet months, and a greater fine-particle contribution during the cooler, drier periods, while cautioning that the ratio reflects meteorology and particle-removal processes as well as emissions and cannot by itself identify specific sources.
Meteorological conditions emerged as strong statistical companions of the pollution cycle. Atmospheric pressure was positively correlated with both PM2.5 (r = 0.737) and PM10 (r = 0.757), consistent with the stable, high-pressure conditions that suppress vertical mixing and allow pollutants to accumulate near the surface. Relative humidity showed negative correlations with both fractions (r = −0.681 and −0.695), as did rainfall (r = −0.497 and −0.601) and wind speed (r = −0.419 and −0.378), reflecting wet scavenging and enhanced dispersion. Air temperature was only weakly correlated with either fraction and did not reach statistical significance. The two pollutants themselves were strongly correlated with each other (r = 0.946), suggesting they responded similarly to seasonal environmental conditions, although the concentration data alone cannot determine whether they shared emission sources or were shaped by similar atmospheric processes.
Multiple linear regression using monthly observations quantified these relationships. Meteorological variables accounted for 67.5 percent of the variation in PM10 and 55.8 percent of the variation in PM2.5 across the overall study period, with both models statistically significant. Season-specific models performed comparably, explaining 68.8 percent of PM10 and 42.1 percent of PM2.5 variation in the rainy season, 63.8 percent and 52.8 percent in the cool season, and 41.1 percent and 58.2 percent in summer. The authors stress that these are observational associations rather than causal relationships, and that a substantial share of the variability remained unexplained, likely reflecting factors outside the analysis such as fluctuations in industrial emissions, traffic intensity, construction activity, biomass burning, regional pollutant transport and atmospheric chemical transformation. The season-specific models should also be read cautiously because each was built from a limited number of monthly observations.
To give the concentration patterns a health-related interpretation, the researchers applied published exposure–response functions to the observed monthly and seasonal concentration scenarios, deriving modelled relative risks, attributable fractions and excess risks for PM10-related all-cause mortality and PM2.5-related cardiopulmonary and lung cancer mortality. These are screening-level comparative indicators, not estimates of actual deaths in the study area. The modelled indicators tracked the pollution cycle closely. For PM2.5-related lung cancer mortality, the relative risk peaked at 1.66 (95 percent confidence interval 1.20–2.29) in January, fell to 1.29 in July and August, and rose again to 1.54 in December. The corresponding cardiopulmonary relative risk declined from 1.40 in January to 1.18 in July and August before increasing to 1.34 in December. For PM10-related all-cause mortality, the relative risk moved from 1.0517 in January to 1.0191 in June and August and back to 1.0431 in December. Seasonally, the cool season produced the highest values, with relative risks of 1.490 for PM2.5-related lung cancer mortality, 1.305 for cardiopulmonary mortality and 1.043 for PM10-related all-cause mortality, compared with rainy-season values of 1.324, 1.206 and 1.022 respectively.
The authors are careful to delineate what these figures do and do not mean. The exposure–response coefficients were drawn from epidemiological studies conducted outside Thailand, and the PM2.5 and PM10 indicators rest on different exposure durations, outcomes and reference conditions, so their absolute values should not be compared with each other. Differences in baseline mortality, population characteristics, healthcare systems and particulate composition may limit transferability of the absolute estimates to the local population. The study also could not characterise particulate chemical composition, identify emission sources through apportionment, or assess individual exposure, susceptibility factors such as age, sex or occupation, or biological responses, because the ecological dataset contained no individual-level clinical or biomarker information.
Even with those caveats, the recurring five-year pattern offers a practical planning signal for the Eastern Economic Corridor. Elevated particulate concentrations and the corresponding modelled indicators returned reliably every cool season, suggesting that surveillance, risk communication and emission-control attention could be intensified before and during November to February, when pollutant accumulation conditions repeatedly developed. The authors recommend that future work extend the analysis to multiple monitoring sites, incorporate chemical composition and source-apportionment methods, examine boundary-layer and regional-transport processes, and pursue locally derived epidemiological evidence linking long-term particulate exposure with health outcomes in Thailand, so that model-based estimates can better support environmental health decisions in rapidly industrialising regions.
Subject of Research: Seasonal variation in PM2.5 and PM10 concentrations, meteorological drivers, and modelled mortality indicators in industrial-suburban Chonburi, Thailand
Article Title: PM 2.5 and PM 10 in industrial-suburban Chonburi, Thailand: Seasonal patterns and modeled mortality indicators
Article References: Nakyai, T., Phatrabuddha, N., Thetkathuek, A., Pannaracha, P., Santasnachok, M., Yingklang, M., & Kulwong, S. (2026). PM2.5 and PM10 in industrial-suburban Chonburi, Thailand: Seasonal patterns and modeled mortality indicators. Environmental Challenges, 25, Article 101700. https://doi.org/10.1016/j.envc.2026.101700
Image Credits: AI Generated
DOI: 10.1016/j.envc.2026.101700
Keywords: PM2.5, PM10, air pollution, Thailand, Chonburi, Eastern Economic Corridor, seasonal variation, meteorology, PM2.5/PM10 ratio, mortality risk, air quality monitoring, Eastern Thailand
Cite Scienmag News
Russell Cooper. (October 27, 2026). Cool-Season Smog Rises Reliably in Thailand’s Industrial East, Five-Year Study Finds. Scienmag. https://scienmag.com/cool-season-smog-rises-reliably-in-thailands-industrial-east-five-year-study-finds/
Russell Cooper. "Cool-Season Smog Rises Reliably in Thailand’s Industrial East, Five-Year Study Finds." Scienmag, 27 October 2026, https://scienmag.com/cool-season-smog-rises-reliably-in-thailands-industrial-east-five-year-study-finds/. Accessed 27 October 2026.
Russell Cooper. "Cool-Season Smog Rises Reliably in Thailand’s Industrial East, Five-Year Study Finds." Scienmag. October 27, 2026. https://scienmag.com/cool-season-smog-rises-reliably-in-thailands-industrial-east-five-year-study-finds/


