


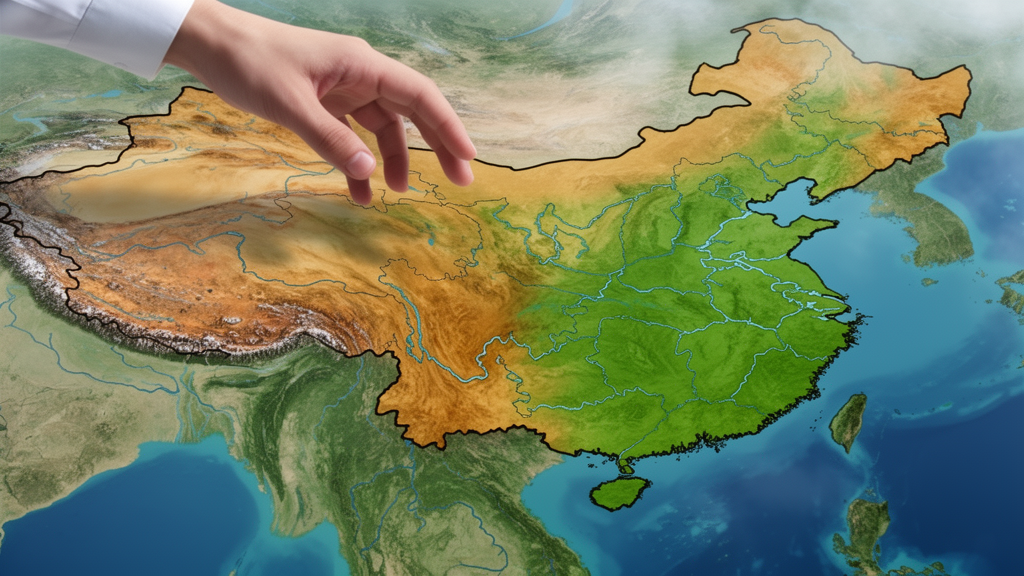
An observational analysis across China found that growing-season vegetation water-use efficiency responded differently to drought, resistance and recovery phases, with patterns varying by drought timescale, vegetation type and location. The study examined anomalies from 1982 to 2018 at 1-, 3- and 12-month drought timescales, comparing water-use efficiency, or WUE, across China’s major vegetation types. WUE is an integrated indicator of ecosystem carbon–water coupling and is used to evaluate how ecosystems respond to drought.
The researchers separated the analysis into three phases: the drought period itself, a resistance period and a recovery period. Their goal was to characterize both the spatial distribution of WUE anomalies and the relative contributions associated with climatic and vegetation factors. During the drought period, the spatial proportion of areas with negative WUE anomalies decreased as the drought timescale increased, while the proportion with positive anomalies increased.
This shift in the share of affected areas did not imply that every location experienced improved efficiency. Instead, the national pattern combined increases in some places with decreases in others, and the responses differed among vegetation types. The normalized difference vegetation index, NDVI, accounted for the greatest proportion of high-contribution areas across China.
Its relative contribution exceeded 30% in croplands. In contrast, the relative contribution associated with vapour pressure deficit, VPD, increased with longer drought timescales and reached 30.7% in grasslands at the 12-month timescale. The analysis quantified these as associated contributions to WUE variation; it did not establish either factor as an independent cause of the observed anomalies.
Exceptions appeared in southwestern China at the 12-month timescale, where positive anomalies were approximately 0.4 g C m−2 mm−1. Precipitation had relatively high contributions to positive WUE anomalies in forests, with reported relative contributions ranging from 33.1% to 35.3%. The recovery period also showed marked geographic variation.
Positive WUE anomalies were more pronounced in southwestern China, whereas persistent negative anomalies remained in the western Qinghai–Tibet Plateau. Values in that latter region reached approximately −0.4 g C m−2 mm−1. The coexistence of positive and negative anomalies demonstrates that the recovery phase did not represent a uniform return to a common efficiency level across the country.
At the 1-month drought timescale, precipitation and temperature were the dominant contributing factors across 52% of China, with precipitation showing the greatest relative contribution in croplands and forests. Together, these results identify climate variables and vegetation-related factors whose contributions varied among ecosystems, drought timescales and response phases, rather than pointing to one driver or a single nationwide pathway. The findings are based on a retrospective observational analysis of growing-season data covering 1982–2018, with drought conditions represented at three timescales and WUE responses separated into resistance and recovery periods.
Because the results are spatial anomaly and relative-contribution estimates, they characterize broad associations across China rather than experimental causal effects. The study nevertheless shows that drought responses were context-dependent: the distribution of increased and decreased WUE shifted among phases, ecosystems and regions, with NDVI, VPD, precipitation and temperature all associated with portions of the observed pattern.
Subject of Research: Spatial variation in vegetation water-use efficiency during drought response phases across China
Article Title: Growing-season vegetation water use efficiency in response to drought events: resistance and recovery periods and underlying drivers
Article References: Tan, Z., Liu, W., Gui, X., Wu, G., Li, Q., Xu, X., & Jiang, L. (2026). Growing-season vegetation water use efficiency in response to drought events: resistance and recovery periods and underlying drivers. Theoretical and Applied Climatology, 157(11), 743. https://doi.org/10.1007/s00704-026-06673-2
Image Credits: AI Generated
DOI: 10.1007/s00704-026-06673-2
Keywords: vegetation water-use efficiency, drought response, ecosystem resilience, NDVI, vapour pressure deficit, carbon–water coupling, China, precipitation, grasslands, croplands, Qinghai–Tibet Plateau, Growing-season
Cite Scienmag News
Violet Maxwell. (October 22, 2026). China drought study maps water-use efficiency across response phases. Scienmag. https://scienmag.com/china-drought-study-maps-water-use-efficiency-across-response-phases/
Violet Maxwell. "China drought study maps water-use efficiency across response phases." Scienmag, 22 October 2026, https://scienmag.com/china-drought-study-maps-water-use-efficiency-across-response-phases/. Accessed 22 October 2026.
Violet Maxwell. "China drought study maps water-use efficiency across response phases." Scienmag. October 22, 2026. https://scienmag.com/china-drought-study-maps-water-use-efficiency-across-response-phases/


