


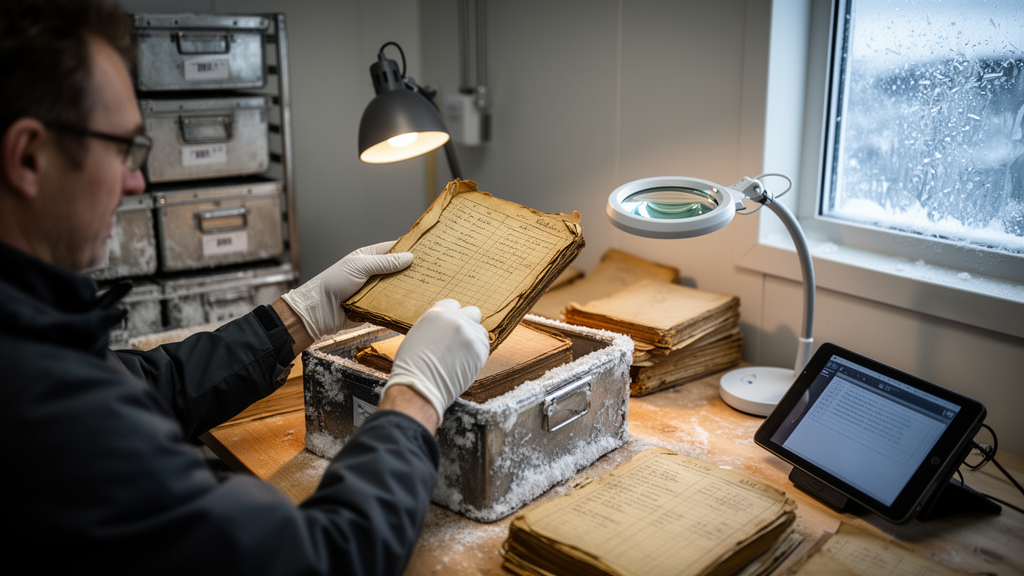
More than a century after explorers huddled through polar winters on the edge of the Arctic Ocean, three long-lost tide gauge records from the Svalbard archipelago have been brought back to life. Philip Woodworth of the National Oceanography Centre in Liverpool and Thorkild Aarup, formerly of the Intergovernmental Oceanographic Commission at UNESCO, have painstakingly converted tabulations of sea level measurements, some dating back to 1872, into modern computer files. Their study, published in the History of Geo- and Space Sciences, shows that these hand-copied numbers are of remarkably good quality and can be fed directly into state-of-the-art tidal analysis software. The work is a striking example of data archaeology, the practice of rescuing historical observations that can anchor modern science in a past that satellite altimeters and digital sensors can never reach.
The oldest of the three records came from Mossel Bay, on the north coast of the largest island of Spitsbergen, during the Swedish polar expedition led by the celebrated explorer Adolf Erik Nordenskiöld. In October and November 1872, the crew of the brig Gladan cut a small square hole in the sea ice and passed a graduated pole through it, fixed at one end in the seabed and standing four or five feet above the ice at the other. A wooden float slid up and down the pole with the tide, and sailors recorded readings every half hour at the changing of the guard. In spring 1873, personnel at the Polhem base repeated the exercise in shallower water, taking hourly measurements from mid-February to late April. The measurements were made in Swedish feet and decimal inches, units slightly smaller than their British equivalents, and the analysis was eventually published by August Wijkander in 1889, years after the expedition returned.
The second record is tied to one of the most haunting episodes in polar history. In June and July 1897, officers and sailors of the gunboat Svensksund read a simple tide board on the shore of Île des Danois at Port Virgo, on the northwest coast of Spitsbergen, during the second Svalbard expedition of Salomon August Andrée, the engineer who later that same year vanished while attempting to reach the North Pole by balloon. A book of the tabulated observations was handed to the physicist Vilhelm Carlheim-Gyllensköld by a sailor named Dahlgren, and the hourly values found their way into his 1905 report. The record spans just over a month, with several gaps filled by graphical interpolation, and the researchers note some confusion in the original documents over whether the times were recorded in local apparent or mean time, an ambiguity they show to be of little practical consequence.
The third and technically most extraordinary record was made at Sorgfjord, on the north coast of Spitsbergen, during the Swedish-Russian Arc-of-Meridian expedition of 1899 to 1902. That campaign, one of the largest geodetic projects of its kind ever attempted, stretched a chain of triangulation points across mountain tops spanning more than four degrees of latitude, in order to measure the length of a meridian arc and determine how much the spherical Earth is flattened at the poles. The Swedish wintering party at Sorgfjord was led by the geodesist Edvard Jäderin, who built much of the expedition’s equipment himself. Because the height of every point in a triangulation network depends on knowing the height of a baseline above mean sea level, a tide gauge was essential, and Jäderin installed one on 26 March 1900 after the expedition’s intended modern gauge, designed by the Finnish geodesist Alfred Petrelius, failed to arrive in time.
What Jäderin improvised has no known precedent or successor. A strong wire, roughly 2.25 millimetres in diameter, was anchored at the foot of a post on land, passed through a hasp on a second weighted post, ran above the recording apparatus, and extended out to a pulley on a tripod frozen into the floating bay ice some 80 to 85 metres from shore. A stone weighing 75 to 100 kilograms hung from the wire below the pulley. Because the ratio of distances along the wire was fixed at one to 17.22, the vertical motion of the ice as the tide rose and fell was reproduced on a chart recorder, traced by a crayon on a thin red copper wire, at 17.22 times magnification. The clock-driven cylinder turned at just 2.3 millimetres per hour, and charts were replaced every Monday at ten in the morning. Datum control came from levelling sights on the ice and from dipping measurements through a hole near the tripod, tied back to benchmarks on land.
Against all expectations, the contraption worked. It produced hourly sea level values spanning 105 consecutive days, from late March to mid-July 1900, with only occasional interruptions of a few hours to several days, during which interpolated values were printed in italics in the original report. Woodworth and Aarup subjected the digitised record to modern harmonic analysis using software that fits 27 independent tidal constituents, appropriate for short records. The resulting amplitudes and phase lags for the two main semidiurnal constituents, M2 and S2, and the two main diurnal ones, K1 and O1, agree closely both with Carlheim-Gyllensköld’s own hand calculations and with the values long listed in the Admiralty Tide Tables. The residuals of the analysis show remarkably little non-tidal variability, as expected for the calm spring and summer months, with only a couple of short suspicious episodes that appear to stem from chart recording or digitisation errors.
The study also untangles a century of confusion in the official tidal literature. The Admiralty Tide Tables values for Sorgfjord, long assumed to derive from a 1930s reanalysis, were in fact computed far earlier by the United States Coast and Geodetic Survey for Robert Harris’s 1911 monograph on Arctic tides. Harris, comparing his values with Carlheim-Gyllensköld’s, mistakenly declared the latter evidently erroneous, apparently failing to realise that the Swedish phase lags were referred to Greenwich while the American ones were local values. A similar mix-up affected the Port Virgo constants, which passed through Harris and later through the Norwegian oceanographers Kjær and Fjeldstad into the modern tables, carrying with them an erroneous S2 phase lag. For Mossel Bay, the researchers identified a 180-degree error in the diurnal phase lags of Wijkander’s original analysis, a mistake noted by George Darwin as early as 1889, and conclude that the original values, once corrected, are the more reliable.
To place the historic measurements in context, the authors compared their computed constants with FES2022b, a leading global ocean tide model built on more than three decades of precise satellite altimetry and advanced hydrodynamic modelling. The agreement is excellent for the semidiurnal tides at all three sites, and good for most of the diurnal components, with the largest discrepancy a difference of about 20 degrees in the O1 phase lag at Mossel Bay for a constituent only centimetres in amplitude. The model also reveals the physics of the region: the M2 tidal wave rotates clockwise around the archipelago, its amplitude falling and its phase lag increasing as one travels east along the north coast of Spitsbergen, while the diurnal tides are comparatively uniform, apart from an amphidromic feature near the southern tip of Spitsbergen. Crucially, the match between the 1872, 1897 and 1900 observations and the modern model suggests there have been no large changes in the tide in this part of the Arctic over the past century and a half.
The researchers are careful to note that the records carry scientific value precisely because tide gauge coverage of the high Arctic remains sparse even today. Shorter modern recordings exist at Sorgfjord, one week in 1938 and three weeks in 2014, and at Port Virgo in 2008 and 2009, but none approaches the length of the historic series. The paper also points to other lost opportunities, including an Italian Hydrographic Institute gauge established in 1928 at Kings Bay in support of Umberto Nobile’s airship flights, whose benchmarks might still survive and could, with new measurements, allow long-term sea level change to be investigated. Above all, the authors pay tribute to the dedicated and often highly qualified participants who took such care with the most basic equipment in brutal conditions, from Jäderin’s wire-and-crayon machine to the sailors reading floats through holes in the ice. Their rescued data, now freely available in digital form, demonstrate that the patient recovery of historical measurements can still pay real dividends for present-day ocean science.
Subject of Research: Historical Arctic tide gauge records from Svalbard and their modern tidal analysis
Article Title: Three historic tide gauge records from Svalbard
Article References: Woodworth, P. L., & Aarup, T. (2026). Three historic tide gauge records from Svalbard. History of Geo- and Space Sciences, 17(1), 1-12. https://doi.org/10.5194/hgss-17-1-2026
Image Credits: AI Generated
Keywords: tide gauges, Svalbard, Arctic, sea level, tidal analysis, harmonic constants, data archaeology, polar exploration, geodesy, FES2022b, ocean tides, history of science
Cite Scienmag News
Courtney Benton. (October 9, 2026). Century-Old Arctic Tide Gauge Records Rescued from Svalbard’s Frozen Archives. Scienmag. https://scienmag.com/century-old-arctic-tide-gauge-records-rescued-from-svalbards-frozen-archives/
Courtney Benton. "Century-Old Arctic Tide Gauge Records Rescued from Svalbard’s Frozen Archives." Scienmag, 9 October 2026, https://scienmag.com/century-old-arctic-tide-gauge-records-rescued-from-svalbards-frozen-archives/. Accessed 9 October 2026.
Courtney Benton. "Century-Old Arctic Tide Gauge Records Rescued from Svalbard’s Frozen Archives." Scienmag. October 9, 2026. https://scienmag.com/century-old-arctic-tide-gauge-records-rescued-from-svalbards-frozen-archives/


