When a driver slams the brakes on an amber light or a tennis player aborts a swing at the last instant, the brain executes one of its most remarkable feats: canceling an action already underway. For decades, scientists have probed this ability with the stop signal task, a laboratory paradigm in which participants race to respond to a go signal but must halt that response when a stop signal occasionally appears. A new study published in Frontiers in Human Neuroscience now shows that two factors long treated as background noise in such experiments — the precise timing of the stop signal and the sequence of trials that precede it — leave systematic fingerprints on the brain’s electrical activity during stopping.
The research, conducted by Knut Andre Skaug, Lars Vidar Magnusson, and Rene Jürgen Huster at the University of Oslo and Østfold University College in Norway, focused on two well-known event-related potential (ERP) components recorded with electroencephalography: the N2, a negative deflection peaking roughly 200 milliseconds after a stop signal, and the P3, a positive deflection around 300 milliseconds. Both components, measured over frontocentral electrodes, have been widely used as neural markers of inhibitory control, and both have repeatedly been compared between successful and failed stopping attempts. Yet the authors argue that the way these signals are typically averaged across trials may conceal important variation driven by the task itself.
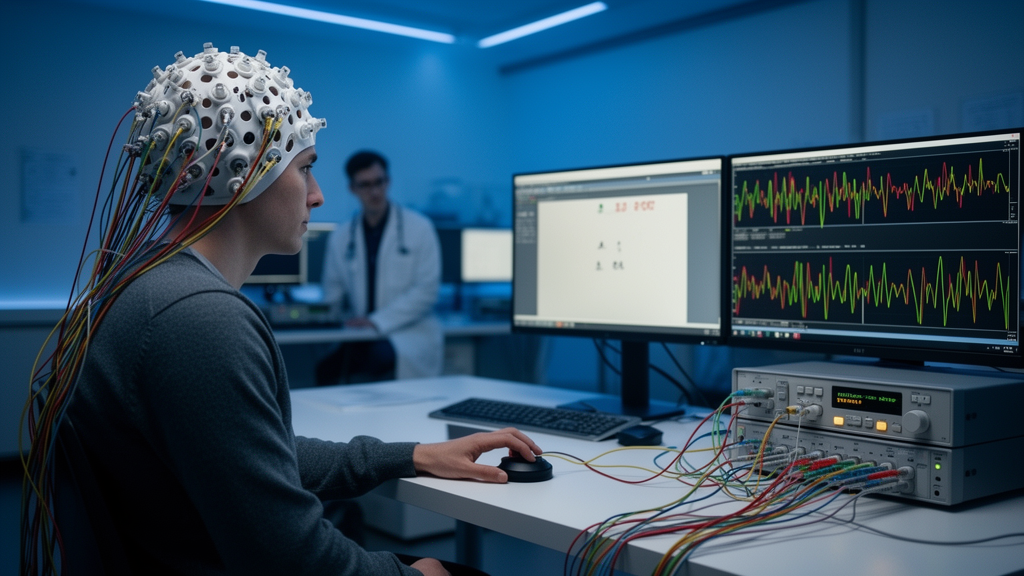
Forty-three adults performed a visual version of the stop signal task while their brain activity was recorded from 31 scalp electrodes at a sampling rate of 5,000 hertz. On each trial, a left- or right-pointing arrow flashed for 100 milliseconds, and on roughly one in four trials the arrow changed color, signaling the participant to cancel the response. The critical variable was the stop signal delay, or SSD: the interval between the go signal and the stop signal. An adaptive staircase procedure lengthened the SSD after each successful inhibition and shortened it after each failure, converging on a success rate near 50 percent and continuously adjusting how hard stopping became.
Because successful stopping is defined by the absence of a movement, the actual latency of the stopping process cannot be observed directly. Instead, researchers rely on the independent horse-race model, which combines go reaction times, SSDs, and the probability of responding to estimate the stop signal reaction time, or SSRT. But the SSD itself is not a fixed experimental parameter; it is an adaptive quantity whose current value reflects the participant’s recent stopping history. The Norwegian team suspected that this ever-changing parameter, together with local sequences of go and stop trials, might systematically shape the N2 and P3 in ways that conventional trial-averaging approaches would miss.
To capture trial-by-trial brain dynamics, the researchers developed a template-matching procedure designed to minimize latency jitter — the trial-to-trial variability in when a component peaks. Latency jitter is a well-known nuisance in ERP research because it can distort amplitude estimates when waveforms are averaged. By iteratively aligning single trials through cross-correlation with a running template, the method sharpened the identification of N2 and P3 peaks on individual stop trials. Amplitudes and latencies were then extracted from the unshifted data, preserving the genuine variability the team wanted to model rather than remove.
The statistical centerpiece of the study was linear mixed effects modeling, which allowed the researchers to relate single-trial N2 and P3 amplitudes and latencies to SSD, sequence history, and stop outcome simultaneously, while accounting for individual differences through random effects. Sequence history was quantified by counting the number of go trials between successive stop trials, with categories ranging from a stop trial immediately following another stop trial to runs of four or more intervening go trials. Interactions between predictors and stop outcome were explicitly tested, and nonlinear relationships were captured with natural cubic splines when visual inspection of the data demanded it.
The results revealed strikingly complex patterns. Both N2 and P3 latencies showed curvilinear associations with SSD: paradoxically, longer stop signal delays — which make stopping harder — were associated with earlier-peaking brain responses. The N2 latency also interacted with stop outcome, with larger differences between successful and failed stopping near the extreme ends of the SSD distribution. After controlling for SSD and sequence, unsuccessful stopping lagged successful stopping by roughly 20 to 25 milliseconds in both components, consistent with the idea that failed inhibition involves delayed neural processing. Notably, sequence history had no effect on the latency of either component, suggesting that timing and history influence the brain’s stopping signals through partly distinct channels.
Amplitudes told a different story. Sequential dependencies emerged as the dominant factor: the N2 became more negative, and the P3 more positive, as the number of preceding go trials increased. The N2 effect was outcome-dependent, with a steeper amplitude decline across go-run lengths on trials where participants successfully stopped, and a relatively smaller N2 following a recently encountered stop trial. The P3 amplitude, by contrast, climbed at a similar rate of roughly one microvolt per preceding go trial regardless of whether stopping ultimately succeeded or failed. This echoes classic findings that the P3 tracks stimulus probability and surprise, and it suggests that part of the P3’s apparent link to inhibitory success may actually reflect the brain’s ongoing bookkeeping of event frequencies rather than inhibition itself.
The SSD effects on amplitudes were more nuanced. N2 amplitude showed a curvilinear relationship, with the most negative values near the average SSD and more positive values at the distribution’s extremes. For P3 amplitude, the association with SSD was highly nonlinear and the fitted linear model captured it only approximately, a limitation the authors acknowledge openly; a significant SSD-by-outcome interaction was observed but interpreted with caution after sensitivity analyses indicated the result depended on the random-effects specification. Across all models, within-individual variability dwarfed the marginal fixed effects, with conditional R-squared values reaching 27 to 45 percent compared with marginal values of 3 to 10 percent — a reminder that trial structure within individuals matters enormously when modeling brain-behavior relationships.
The implications reach well beyond the laboratory. Response inhibition is a central construct in theories of impulsivity across psychiatric conditions, and the stop signal task is a workhorse for comparing clinical populations with healthy controls. The authors warn that if patient and control groups systematically differ in their SSD distributions — as the adaptive staircase makes likely when stopping ability differs — then unmodeled SSD effects could bias group contrasts in N2 and P3 measures, much as prior fMRI work showed that absolute SSD differences inflated apparent group differences in brain activity. Similarly, unaccounted sequence effects could masquerade as group differences in inhibitory processing. The study’s message is clear: the N2 and P3 are not pure readouts of a stopping mechanism but dynamic signals entangled with task timing and trial history, and researchers who ignore that entanglement risk drawing distorted conclusions about how inhibition fails — or succeeds — in the disordered brain.
Subject of Research: EEG correlates of response inhibition in the stop signal task
Article Title: Sequence effects and SSD are associated with N2 and P3 signals during stopping in a visual stop signal task
Article References: Sequence effects and SSD are associated with N2 and P3 signals during stopping in a visual stop signal task. (n.d.). https://doi.org/10.3389/fnhum.2026.1906495
Image Credits: AI Generated
DOI: 10.3389/fnhum.2026.1906495
Keywords: response inhibition, stop signal task, EEG, ERP, N2, P3, stop signal delay, sequence effects, mixed effects modeling, cognitive control, SSRT, frontocentral electrodes
Cite Scienmag News
Cassandra Pierce. (October 16, 2026). Brain Signals of Stopping Are Shaped by Task History and Timing, EEG Study Reveals. Scienmag. https://scienmag.com/brain-signals-of-stopping-are-shaped-by-task-history-and-timing-eeg-study-reveals/
Cassandra Pierce. "Brain Signals of Stopping Are Shaped by Task History and Timing, EEG Study Reveals." Scienmag, 16 October 2026, https://scienmag.com/brain-signals-of-stopping-are-shaped-by-task-history-and-timing-eeg-study-reveals/. Accessed 16 October 2026.
Cassandra Pierce. "Brain Signals of Stopping Are Shaped by Task History and Timing, EEG Study Reveals." Scienmag. October 16, 2026. https://scienmag.com/brain-signals-of-stopping-are-shaped-by-task-history-and-timing-eeg-study-reveals/