


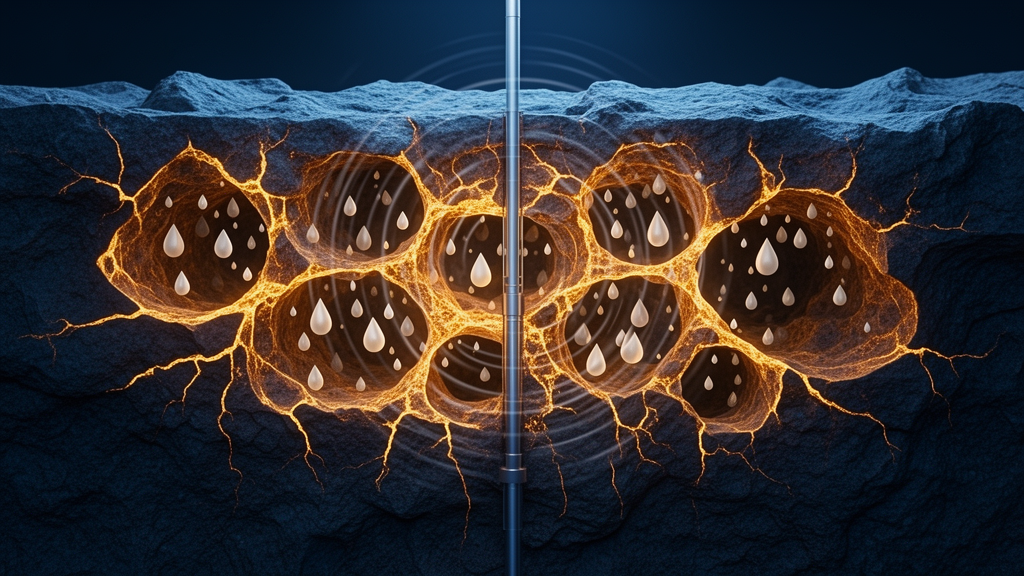
Deep beneath the desert of the Tarim Basin in western China, natural gas sits in some of the most structurally chaotic reservoirs ever tapped by the petroleum industry. More than eight kilometers below the surface, the rock is neither a neat sponge nor a solid slab. Instead, it is a wild, fault-sculpted labyrinth of tight carbonate matrix, open karst caverns large enough to swallow drilling fluid by the thousands of cubic meters, and natural fracture corridors running along ancient strike-slip faults. When this kind of reservoir also holds condensate gas — a hydrocarbon that behaves like gas at high pressure but condenses into liquid oil as pressure falls — the physics of how pressure behaves around a producing well becomes extraordinarily difficult to read. A new open-access study published in Environmental Earth Sciences by Yang Zuoming and Zhao Renbao of the State Key Laboratory of Petroleum Resources and Engineering at China University of Petroleum, together with Liu Hailong of Sinopec Petroleum Exploration and Development Research Institute, has now built a mathematical framework that finally makes sense of the pressure instability recorded by gauges in these ultra-deep wells, and it has passed a striking real-world test: its reserve estimates for one Shunbei well landed within about one percent of an independent material-balance calculation.
The stakes are far higher than an academic curiosity about pressure curves. Bottomhole pressure is the fundamental vital sign of a gas well. It tells engineers how much energy the reservoir still has, how fast the well can be produced without damaging the formation, and how much gas remains to be recovered. In conventional reservoirs, standard well-test interpretation — the discipline of reading pressure buildup data after a well is shut in — has been refined over more than half a century, anchored by classical solutions such as those of Agarwal, Al-Hussainy and Ramey from 1970. But the Shunbei area of the Tarim Basin breaks every assumption those classical tools rely on. Drilling there has repeatedly confirmed a distinctive “grid-like” architecture in which fault-controlled caves, fracture systems and tight bedrock are intertwined and interbedded. Fluid flow inside such a system is a patchwork of different regimes: multiphase condensate gas flow in the fracture corridors, free flow inside large vugs that can reach meter scale, and linear flow through natural fractures. No single textbook model can describe all of that at once.
The research team identified two fundamental flaws in the existing toolkit. First, most well-test models for fractured-vuggy carbonates lean on the so-called triple-continuum framework, which treats matrix, fractures and vugs as three overlapping continua exchanging fluid with one another. That approach works when vugs are small and numerous enough to behave statistically like a continuum. In Shunbei, it does not. The caves are discrete, meter-scale bodies whose interiors obey free-flow, not Darcy seepage, and their random, non-uniform distribution violates the continuum assumption outright. A triple-continuum model therefore cannot deliver the engineering parameters that actually matter — the volume of an individual vug, the number of vugs, or the distance between them. Second, retrograde condensation carves the fracture conduit itself into three distinct zones as pressure falls: a two-phase oil-and-gas region near the well, an adsorbed-oil transition region, and a dry-gas region farther out. Conventional triple-porosity models simply do not account for this condensation-induced three-zone composite flow, nor do they reconstruct the wellbore storage coefficient from the actual depth at which the pressure gauge is deployed — a detail that becomes critical in wells drilled to more than 8,000 meters true vertical depth.
The team’s answer is a comprehensive well-test interpretation model built around a well–vug–fracture–vug combination, with simpler configurations treated as degenerate subcases. Its first novelty is a new pseudo-pressure function defined on the basis of mass flow rate. In a wellbore where gas and liquid are fully miscible, pressure, temperature, density and composition all vary from one cross-section to another, so the traditional gas pseudo-pressure definition — which integrates pressure-dependent viscosity and compressibility — no longer meets practical needs. The researchers instead invoked the law of conservation of mass: whatever changes occur inside the wellbore, the mass of substance passing through different cross-sections per unit time must remain consistent. By defining pseudo-pressure as an integral of relative permeability, viscosity and density together, they collapsed the daunting three-zone multiphase flow in the fracture corridor into a mathematically linear single-phase problem. Because miscible density cannot be expressed analytically, the pseudo-pressure is evaluated through an iterative numerical scheme that couples in-situ liquid saturation to pressure through the PVT equation of state, repeating the calculation until saturation converges to within a tolerance of ten to the minus four.
The second novelty tackles a puzzle that has long shown up on pressure gauges in these wells: early log–log type curves that mysteriously “drop” and form “humps.” The culprit is the pressure gauge itself. In ultra-deep condensate gas wells, gauges often cannot be run all the way to bottomhole, and retrograde condensation at the bottom can raise the oil-phase liquid level above the instrument. The team worked through the two possible scenarios. When the gauge sits deep, submerged in the liquid phase with the level above it, the wellbore phase-change pressure buildup rate equals the formation pressure buildup rate, and constant wellbore storage applies. When the gauge sits shallow, in the gas phase with the liquid level below it, the phase-redistribution pressure change exceeds the formation pressure change, and an additional pressure term — modeled with an error-function distribution following the established work of Fair and of Hegeman and colleagues — must be subtracted from the measurement. The result is a variable wellbore storage model tied to actual gauge depth, which theoretically explains the early decline of the log curve and the growing hump as the additional pressure accumulates. For an industry that has spent years puzzled by these distorted early-time signals, that explanation alone is a significant prize.
The mathematics is solved analytically in the Laplace domain, with the well-vug part handled directly through Duhamel’s principle and the fracture-vug-fracture part solved step by step using separation of variables and superposed point-source solutions; type curves are generated via Stehfest numerical inversion. Before trusting the model, the team validated it against two classical benchmarks. With fracture and vug parameters set to zero, their dimensionless pressure curves matched the Agarwal et al. homogeneous-reservoir solution with excellent agreement. With discrete vug storage terms zeroed and the fracture zone treated as a continuum, the curves reproduced the triple-porosity solution of Xing and Yan from 2009 with a high degree of consistency. The full model’s type curves then revealed a rich sequence of flow stages — up to eleven of them when phase change occurs — spanning wellbore storage, vug storage, fracture-zone linear flow and their transitions, some stages even showing the pressure derivative rising above the pressure curve itself. From the asymptotic solutions of four characteristic stages, the team derived a characteristic-line analysis method that can extract wellbore storage coefficient, individual vug volumes, fracture-zone volume, length and conductivity directly from the curve geometry, cutting the average interpretation time for a single well to roughly two minutes.
Sensitivity analysis mapped how each parameter shapes the curves. A larger wellbore storage coefficient lowers the y-axis intercept and delays the formation response, swallowing more effective buildup data — which is why field measures such as downhole shut-in and small-diameter tubing strings matter. The skin factor acts like a vertical translation ruler, extending afterflow duration without altering flow-stage sequence. Fracture-zone length controls linear-flow duration through a logarithmic inverse relationship with pressure drop, while higher flow conductivity makes pressure propagate faster, causing linear flow to appear earlier and last longer; if conductivity falls too far, linear flow can shorten or vanish completely. Expanding the condensation range from 30 to 60 increases the bottomhole pressure drop by an additional 0.35 in dimensionless terms, and the degree of condensation shifts the timing and position of linear-flow segments across the two-phase, adsorption and dry-gas zones. Vug volume, meanwhile, governs the depth and width of the “concaves” on the derivative curve — bigger vugs supply gas more strongly and steadily, and field engineers can now estimate vug volumes directly from those concave signatures.
The decisive trial came at Well M, a horizontal well drilled perpendicular to a major northeast-trending fault zone in the Shunbei area. At a measured depth of 8,302.14 meters, the well kicked off by 3.58 meters and lost mud completely, with cumulative working-fluid losses during drilling and completion reaching 4,035.26 cubic meters — a dramatic fingerprint of a large connected vug system. After acidizing with 893 cubic meters to clear near-wellbore damage, the well produced 717,000 cubic meters of gas and 148 cubic meters of oil per day through a 10-millimeter choke at 58.1 megapascals tubing pressure. Forty-seven hundred hours into production, the wellhead was shut in for a pressure buildup test that showed the classic hump effect and two distinct concaves on the pressure derivative, sandwiching a linear segment — the sequential signature of near-wellbore vug storage, fracture-zone linear flow and far-field vug storage. The team applied their two-step workflow, using characteristic-line matching on the log–log type curve for initial parameter estimates and a semi-log Horner plot to independently verify permeability and reserves, all implemented in a custom MATLAB routine performing Stehfest inversion and least-squares fitting.
The verdict after one and a half years of pilot production: the well-test interpretation yielded dynamic reserves of 356.5 million cubic meters, while the material-balance method — an entirely independent accounting of production and pressure depletion — determined 361.1 million cubic meters. The gap is barely more than one percent, a result the authors say strongly verifies the scientific reliability of the model. Beyond the numbers, the framework deepens understanding of how these exotic reservoirs actually behave, and it hands development engineers a practical tool: by reading the timing and position of the “second step” on a pressure derivative, operators can infer the condensation range of a gas well and use that to guide pressure-controlled production or optimize injection timing. For the ultra-deep frontier of the Tarim Basin — and for any fractured-vuggy condensate gas reservoir elsewhere on Earth — the era of guessing at bottomhole pressure instability may finally be drawing to a close.
Subject of Research: Analysis of bottom hole pressure instability in ultra deep fracture-vuggy type condensed gas reservoirs
Article Title: Analysis of bottom hole pressure instability in ultra deep fracture-vuggy type condensed gas reservoirs
Article References: Zuoming, Y., Renbao, Z., & Hailong, L. (2026). Analysis of bottom hole pressure instability in ultra deep fracture-vuggy type condensed gas reservoirs. Environmental Earth Sciences, 85(17), Article 434. https://doi.org/10.1007/s12665-026-13144-4
Image Credits: AI Generated
DOI: 10.1007/s12665-026-13144-4
Keywords: Analysis, bottom, hole, pressure, instability, ultra, deep, fracture-vuggy, type, condensed, reservoirs, scientific research
Cite Scienmag News
Violet Maxwell. (October 17, 2026). Analysis of bottom hole pressure instability in ultra deep fracture-vuggy type condensed gas reservoirs. Scienmag. https://scienmag.com/analysis-of-bottom-hole-pressure-instability-in-ultra-deep-fracture-vuggy-type-condensed-gas-reservoirs/
Violet Maxwell. "Analysis of bottom hole pressure instability in ultra deep fracture-vuggy type condensed gas reservoirs." Scienmag, 17 October 2026, https://scienmag.com/analysis-of-bottom-hole-pressure-instability-in-ultra-deep-fracture-vuggy-type-condensed-gas-reservoirs/. Accessed 17 October 2026.
Violet Maxwell. "Analysis of bottom hole pressure instability in ultra deep fracture-vuggy type condensed gas reservoirs." Scienmag. October 17, 2026. https://scienmag.com/analysis-of-bottom-hole-pressure-instability-in-ultra-deep-fracture-vuggy-type-condensed-gas-reservoirs/


