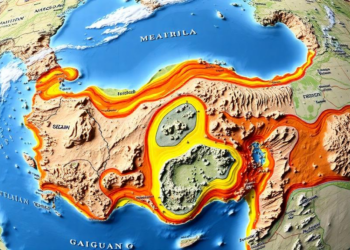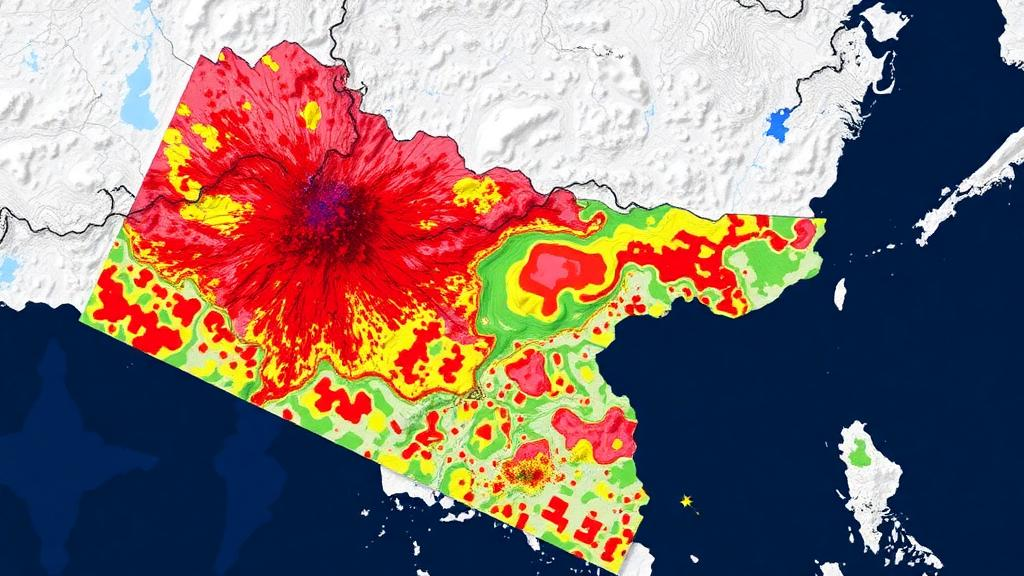
Nepal has long been described as one of the most disaster-prone countries on Earth, squeezed between active seismic faults, some of the steepest terrain gradients on the planet, and the ferocious seasonal rainfall of the Asian monsoon. A new national-scale study published in Discover Geoscience has now mapped, for the first time, exactly where the country’s two deadliest hazards, floods and landslides, are most likely to occur, and, crucially, where they interact. Using machine learning models running on Google’s cloud-based Earth Engine platform, researchers from the International Centre for Integrated Mountain Development (ICIMOD) produced susceptibility maps that reveal how slope failures in the high Himalaya are spatially wired to flood-prone valleys downstream, creating corridors where a single trigger can set off a chain of destruction.
The study’s lead finding is stark: roughly 19 percent of Nepal’s lowland areas fall into medium to very high flood susceptibility zones, threatening approximately 900,000 people and more than 3.4 million buildings. In the hillier terrain, the picture is equally sobering, with about 40 percent of the country susceptible to slope failure, endangering around 200,000 people and some 600,000 buildings. These are not abstract statistics in a nation where, over the past half century, disasters have killed an average of two people every day and affected more than 300 families annually. Landslides alone claim an average of 113 lives each year, while floods account for more than nine percent of disaster deaths and touch over sixty percent of affected families.
What sets this research apart from previous hazard assessments is its methodological machinery. Traditional susceptibility mapping in Nepal has relied heavily on multi-criteria analysis, a GIS technique in which experts assign subjective weights to variables such as slope, elevation and land cover. That approach struggles to capture the tangled, non-linear relationships that govern where water flows and where slopes fail. The ICIMOD team instead deployed a Random Forest model, an ensemble machine learning algorithm that builds hundreds of decision trees, each trained on random subsets of the data, and averages their predictions into a continuous probability score between zero and one. Hyperparameter tuning across 400 to 600 trees showed that 600 delivered the best performance, and the resulting models achieved strong discrimination, with an area under the receiver operating characteristic curve of 0.84 for floods and 0.85 for landslides.
The variable lists themselves tell a geomorphological story. For floods, accessibility and flow accumulation ranked as the most important predictors, followed by landform, land cover and slope, confirming that monsoon runoff concentrates in river corridors where human development presses closest to the water. For landslides, slope steepness and aspect dominated, with vegetation greenness, captured through the Normalized Difference Vegetation Index, coming in third. Validation against independent datasets added credibility: the flood model agreed 74 percent with an established hydrological inundation product, while the landslide model matched a manually digitized inventory of landslides triggered by the devastating 2015 Gorkha earthquake with 81 percent agreement.
The truly novel step came after the single-hazard maps were complete. The researchers fed the flood and landslide probability surfaces into an unsupervised k-means clustering algorithm, which partitioned every spatial unit of the country into three natural groupings without any expert-defined thresholds: low-hazard zones, flood zones and landslide zones. A subsequent spatial adjacency analysis, a GIS operation that identifies polygons sharing boundaries, then carved out a fourth category: interaction zones, where landslide-susceptible slopes physically touch flood-susceptible river corridors. Nationally, this data-driven classification assigned 81 percent of the territory to the low-hazard category, nine percent to flood zones, five percent to landslide-only zones and five percent to interaction zones.
Those interaction zones matter because of what they represent physically. In mountainous terrain, the boundary between a steep, fragile hillslope and an active river channel is not an arbitrary line on a map; it is the slope-toe interface where debris from slope failures enters the drainage network and can amplify downstream inundation. By applying the adjacency operator a second time, linking interaction zones to downstream flood-prone polygons, the team delineated what they call critical multi-hazard flow zones: roughly 7,588 square kilometres of connected corridors that funnel hazard material from unstable headwaters toward populated valleys. These corridors overlap 88 square kilometres of built-up land, about twelve percent of Nepal’s total urban footprint, and 1,722 square kilometres of cropland.
The authors are careful to note that these flow zones represent susceptibility-based spatial connectivity, a screening-level proxy, rather than physically simulated cascading processes. Full hydrodynamic modelling of landslide-dam formation, breach dynamics and downstream flood propagation was beyond the scope of the study. Yet the screening framework has already proven its relevance against real events. The catastrophic 2021 Melamchi disaster, in which intense upstream rainfall, landslides and debris flows cascaded into a flood that devastated downstream settlements and the Melamchi drinking water supply project serving Kathmandu, followed precisely the source-to-sink pathway the mapping is designed to flag. The July 2025 transboundary outburst flood from Nepal’s border with China, which swept away a critical trade bridge at Rasuwaghadi, underscores the stakes for infrastructure planning in similar corridors.
The study also exposes an uncomfortable institutional blind spot. In Nepal, flood hazards are managed by the Department of Hydrology and Meteorology while landslides fall under the Department of Mines and Geology, a siloed arrangement that treats physically coupled processes as administratively separate phenomena. Meanwhile, current national building regulations rely on uniform river-buffer setbacks, thirty metres from rivers, fifty metres from lakes, ten metres from canals, that bear no relationship to actual topographic susceptibility. Satellite imagery documenting the transformation of the Sardu Khola floodplain in Sunsari District, from sparse settlement and intact farmland in 2004 to dense housing and road networks by 2025, illustrates how rapidly exposure is accumulating in exactly the wrong places.
The researchers argue their maps can shift Nepal from reactive post-disaster relocation toward proactive risk screening. Low-hazard zones, often found on stable interfluves and elevated terraces even within high-risk basins like Melamchi, should be prioritized for settlement expansion and critical infrastructure. Interaction zones, by contrast, warrant strict regulatory controls and could even be designated no-development areas. The framework extends beyond government planning: banks and infrastructure investors, including those financing hydropower projects and strategic road corridors across the Himalaya, could use the flow zones as preliminary geospatial due diligence, embedding geological risk assessment into lending decisions before capital is committed to hazardous ground.
Limitations remain, and the authors flag them candidly. The models were trained on historical inventories that treat hazard patterns as stationary, even as climate change intensifies rainfall extremes and vegetation recovery alters slope stability, a tension visible in the divergent bias patterns between the flood and landslide validations. Detailed lithology, groundwater dynamics and real-time hydrometeorological data were unavailable, and spatial block cross-validation was not implemented. Exposure figures should therefore be read as indicative screening estimates rather than precise measurements. Still, as a replicable, computationally efficient template for data-scarce mountain nations, the framework aligns squarely with the Sendai Framework for Disaster Risk Reduction and the Sustainable Development Goals, offering a pathway for risk-informed land-use planning that could save lives before the next monsoon arrives.
Subject of Research: National-scale flood and landslide susceptibility and multi-hazard interaction mapping in Nepal using machine learning and GIS
Article Title: Flood and landslide susceptibility assessment and multi hazard interaction mapping using machine learning and GIS for sustainable settlement planning in Nepal
Article References: Thapa, N., Uddin, K., Thapa, R. B., & Udas, E. (2026). Flood and landslide susceptibility assessment and multi hazard interaction mapping using machine learning and GIS for sustainable settlement planning in Nepal. Discover Geoscience, 4(1), Article 287. https://doi.org/10.1007/s44288-026-00670-8
Image Credits: AI Generated
DOI: 10.1007/s44288-026-00670-8
Keywords: Nepal, flood susceptibility, landslide susceptibility, machine learning, Random Forest, k-means clustering, GIS, multi-hazard, spatial adjacency analysis, Google Earth Engine, land-use planning, disaster risk reduction
Cite Scienmag News
Violet Maxwell. (October 12, 2026). AI Maps Where Nepal’s Floods and Landslides Collide. Scienmag. https://scienmag.com/ai-maps-where-nepals-floods-and-landslides-collide/
Violet Maxwell. "AI Maps Where Nepal’s Floods and Landslides Collide." Scienmag, 12 October 2026, https://scienmag.com/ai-maps-where-nepals-floods-and-landslides-collide/. Accessed 12 October 2026.
Violet Maxwell. "AI Maps Where Nepal’s Floods and Landslides Collide." Scienmag. October 12, 2026. https://scienmag.com/ai-maps-where-nepals-floods-and-landslides-collide/