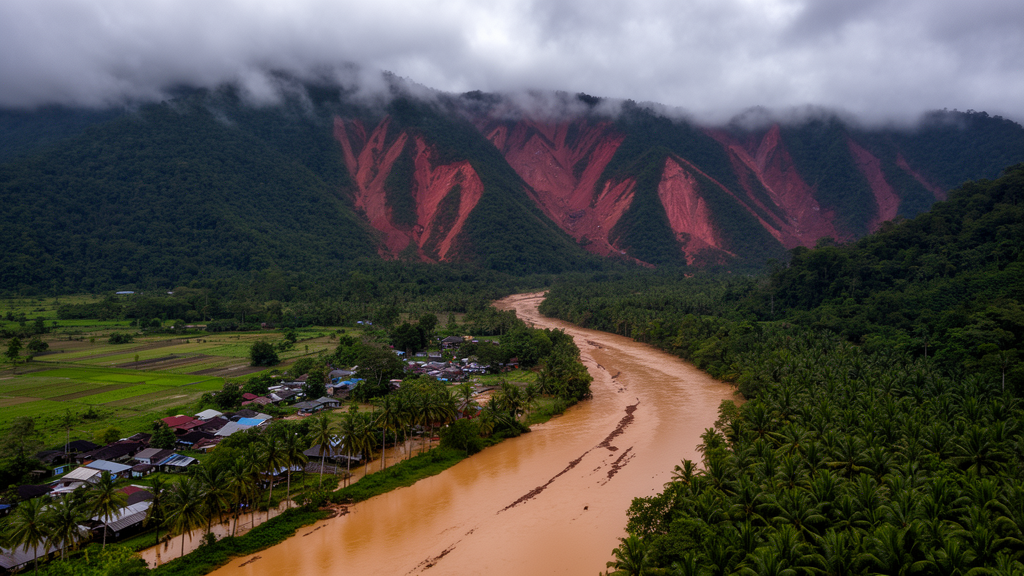
Floods and landslides are usually mapped separately, even when they strike the same river basin. A new study of the Langat Catchment in Selangor, Malaysia, has combined the two into a single multi-hazard susceptibility map, showing where lowland flooding and hillslope instability overlap within one hydrological system. The work, published in Geoenvironmental Disasters, covers three districts: Hulu Langat, Sepang, and Kuala Langat.
The research team, led by Muhammad Wafiy Adli Ramli, applied a geographical information system (GIS)-based frequency ratio (FR) method to build individual flood and landslide susceptibility surfaces at a consistent 10-metre spatial resolution. The frequency ratio is a bivariate statistical technique that compares the share of historical hazard occurrences falling within a class of a conditioning factor against the share of the total study area that class occupies. Classes holding more hazard events than expected by area receive values above one, flagging them as disproportionately hazardous. The method was chosen for its transparency and interpretability rather than for raw predictive power, since the study’s principal aim was an operational integration framework rather than a comparison of competing algorithms.
Twelve conditioning factors fed the models: elevation, slope, curvature, aspect, rainfall, distance to river, distance to road, distance to fault line, soil, geology, land use, and the topographic wetness index (TWI), which estimates where water is likely to accumulate. Terrain derivatives were generated from a 10-metre interferometric synthetic aperture radar digital elevation model supplied by the Department of Irrigation and Drainage Malaysia. Rainfall records spanning 2010 to 2024 came from the same agency, while soil, geology, and fault line data were obtained from the Department of Mineral and Geoscience Malaysia and land-use data from PLANMalaysia. All layers were projected into a common coordinate system, clipped to the catchment, converted to raster format, resampled to 10 metres, and classified before analysis.
The two hazards were modelled from separate inventories and hazard-specific factor sets rather than one common set. Flood susceptibility drew on factors including land use, slope, distance to river, soil, geology, elevation, rainfall, TWI, curvature, distance to road, and aspect. Landslide susceptibility added distance to fault line to a similar list. The researchers deliberately avoided conventional correlation analysis for factor selection, arguing that mixing continuous variables such as elevation and rainfall with categorical ones such as geology and soil would make a single Pearson or Spearman assessment inconsistent, and noting that the FR method evaluates each factor class independently against hazard occurrence.
The results reveal a striking physiographic split. Flood susceptibility concentrates in the lower catchment: 28.8 percent of the area falls in the high class and 9.7 percent in the very high class, centred on the lowlands of Sepang and Kuala Langat. Water bodies recorded the highest flood frequency ratio at 4.34, followed by industrial areas at 1.48. The flattest slope class, 0 to 10 degrees, scored 1.25, areas within one kilometre of rivers scored 1.73, and the lowest elevation band, from minus 13 to 33 metres, scored 1.54. The TWI class of 20.01 to 28.5 showed the single strongest terrain association at 4.05, while sedentary soil (2.06), alluvial soil (1.61), and clay-and-silt geology (2.18) all pointed to the role of fine-grained, poorly draining materials in ponding and runoff.
Landslide susceptibility tells the mirror-image story in the hills. The very high class covers 15.5 percent of the catchment, concentrated in the steep, upper terrain of Hulu Langat, while 53.7 percent of the area, dominated by the flatter lower districts, sits in the very low class. Slopes of 30 to 45 degrees recorded the highest landslide frequency ratio at 4.08, with the 20 to 30 degree class close behind at 3.90. Elevation showed the strongest single signal: the 108 to 206 metre band scored 6.54 and the 206 to 316 metre band 6.41, indicating that mid-elevation terrain, not the highest ridges, carries the greatest landslide potential. Acid intrusive geology scored 3.16, forest land use 3.49, and concave curvature 1.95, the latter suggesting that terrain shape concentrates water and undermines slope stability.
The integration step is where the study departs from most previous work. The two susceptibility maps, each classified into five levels from very low to very high, were standardized and combined using hazard-specific moderation factors adapted from a local integrated disaster risk assessment framework developed for Malaysia. Flood, classified as a high-frequency hazard with a return probability of roughly one in twenty years, received a moderation factor of 1.00. Landslide, treated as a medium-frequency hazard at roughly one in forty years, received 0.50. This weighting reflects Malaysia’s disaster profile: the Department of Statistics Malaysia recorded 224 natural disasters in 2024, of which 218 were floods and only two were landslides. A multi-hazard index then combined the moderated individual hazard values with a term representing spatial interaction between the two hazards, taking the highest individual hazard value per pixel.
The resulting map classifies 5.0 percent of the catchment as very low, 20.8 percent as low, 31.8 percent as moderate, 11.5 percent as high, and 30.9 percent as very high multi-hazard susceptibility. Notably, the very high class expanded from 9.7 percent in the flood-only map and 15.5 percent in the landslide-only map to 30.9 percent in the integrated product, showing that the combined approach flags a broader area of concern than either hazard alone. The very high zones span mukims in the lower and middle catchment, including parts of Kuala Langat, Sepang, Dengkil, Labu, Tanjung Dua Belas, Telok Panglima Garang, Batu, Bandar, Morib, and Jugra, driven by flood factors such as low elevation, river proximity, alluvial soils, and high TWI. The upper catchment mukims of Hulu Langat, including Ampang, Cheras, Kajang, Semenyih, and Beranang, show a mix of moderate, high, and very high classes where landslide-prone slopes intersect river corridors.
Validation lent the map quantitative support. An area under the receiver operating characteristic curve of 0.803 indicates good predictive performance, since values above 0.8 are generally considered good for susceptibility models. A second, point-based check used 498 independent locations: 200 recorded disaster points and 298 non-disaster points. Of the disaster locations, 122, or 61.0 percent, fell within the high and very high susceptibility classes, with 87 in the very high class and 35 in the high class, while 193 of the non-disaster points, or 64.8 percent, fell in the moderate to very low classes. Overall classification accuracy reached 63.3 percent. The authors acknowledge that some disaster and non-disaster points overlapped across classes, which they attribute to the many spatial, environmental, and triggering conditions influencing hazard occurrence in a multi-hazard setting.
The catchment’s hazard history underscores why integration matters. Between 2014 and 2019, 176 flood events were recorded across the three districts, and a major landslide in Hulu Langat in 2011 killed 16 people. Hulu Langat was also severely hit during the December 2021 floods, with Batu 22 and Batu 23 in Kampung Sungai Lui among the worst-affected locations. The authors position the map as a transparent spatial decision-support tool for land-use planning, mitigation prioritization, infrastructure protection, and emergency preparedness, and argue the framework could transfer to other tropical, rapidly urbanizing catchments where lowland flooding and rainfall-induced slope failure coexist. They also note the study’s limits: only the frequency ratio method was tested, without comparison against machine learning or ensemble models, and future work should evaluate approaches such as random forest, support vector machines, and gradient boosting with balanced hazard and non-hazard samples and spatial cross-validation before refining the integrated framework.
Subject of Research: Integrated flood and landslide susceptibility mapping in the Langat Catchment, Malaysia
Article Title: Integrating flood and landslide susceptibility for multi-hazard assessment in the Langat Catchment, Malaysia
Article References: Ramli, M. W. A., Alias, N. E., Sa’adi, Z., Abd Rahman, A., Wahab, Y. F. A., Wan Ibrahim, W. M. M., Marsani, M. F., Mohd Salleh, M. R., & Mahamud, M. A. (2026). Integrating flood and landslide susceptibility for multi-hazard assessment in the Langat Catchment, Malaysia. Geoenvironmental Disasters, 13(1), Article 63. https://doi.org/10.1186/s40677-026-00417-0
Image Credits: AI Generated
DOI: 10.1186/s40677-026-00417-0
Keywords: flood susceptibility, landslide susceptibility, multi-hazard assessment, Langat Catchment, Malaysia, frequency ratio, GIS, Selangor, Hulu Langat, disaster risk reduction, AUC-ROC validation, land-use planning
Cite Scienmag News
Violet Maxwell. (October 28, 2026). Floods and landslides mapped together in one Malaysian catchment risk picture. Scienmag. https://scienmag.com/floods-and-landslides-mapped-together-in-one-malaysian-catchment-risk-picture/
Violet Maxwell. "Floods and landslides mapped together in one Malaysian catchment risk picture." Scienmag, 28 October 2026, https://scienmag.com/floods-and-landslides-mapped-together-in-one-malaysian-catchment-risk-picture/. Accessed 28 October 2026.
Violet Maxwell. "Floods and landslides mapped together in one Malaysian catchment risk picture." Scienmag. October 28, 2026. https://scienmag.com/floods-and-landslides-mapped-together-in-one-malaysian-catchment-risk-picture/