


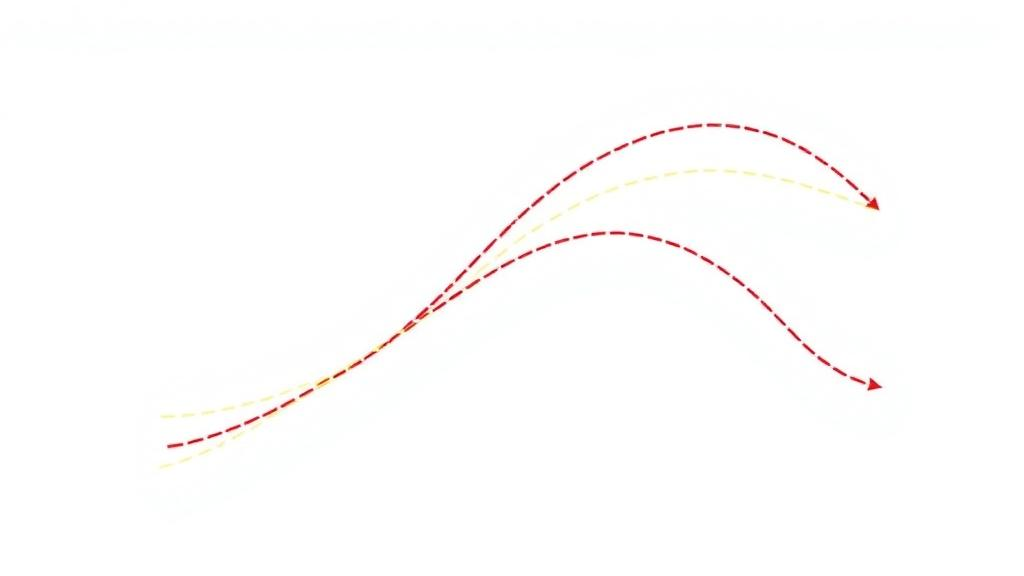
A tutorial using six waves of data from South Korean adolescents shows that a developmental transition can look very different depending on the statistical lens applied. Piecewise multilevel modeling found that national identity rose during middle school and then declined during high school, but latent class analysis uncovered substantially different pathways hidden by the population average. A third method showed that adolescents tended to remain in low, moderate or high identity states rather than move directly between the extremes. The work, published in Frontiers in Psychology in 2026, demonstrates how three related but conceptually distinct piecewise models can be implemented in the open-source R environment.
The empirical example draws on the Multicultural Adolescents Panel Study, a nationally representative longitudinal survey conducted annually in South Korea from 2019 through 2025. The analysis used six annual assessments of national identity across middle and high school, with three observations in each educational stage. National identity was measured through four items on a four-point Likert scale, including statements about feeling praised when Korea is praised, interest in foreign views of Korea, viewing Korea’s success as one’s own, and feeling offended by negative comments about Korea. The move from middle to high school was fixed in advance as the changepoint because the study design and educational transition already defined two stages; it was not discovered from the identity data.
The first approach, piecewise multilevel modeling, estimates an average intercept and a separate slope for each developmental stage while allowing those quantities to vary between individuals. In R, the authors used lme4 and lmerTest. Time was represented by two variables: one counted movement through the three middle-school waves, while the other counted movement through the three high-school waves. This coding keeps the stages continuous without implying that the same rate applies throughout. Four specifications were compared, including random-intercept and random-slope versions of the segmented and single-slope models. The full piecewise model with random intercepts and stage-specific random slopes produced the lowest Akaike information criterion and Bayesian information criterion.
That model estimated an average initial national-identity score of 10.47, with a standard error of 0.06. Identity increased by an estimated 0.31 points per wave during middle school and decreased by 0.10 points per wave during high school; both changes had p-values below 0.001. These are model-based estimates from the survey analysis, not evidence that the educational transition itself caused either change. Random-effect variances showed meaningful heterogeneity in starting levels and in both rates of change. Adolescents who began with higher identity tended to show smaller middle-school increases and less pronounced high-school declines. The correlation between the two stage-specific slope factors was only 0.09, indicating that change in one educational phase was largely unrelated to change in the next within the fitted model.
Piecewise latent class growth modeling asks a different question: whether participants follow qualitatively distinct trajectories rather than varying continuously around one average path. Implemented with the lcmm package, the authors compared models containing one through four classes, allowing each class to have its own intercept and middle- and high-school slopes. A four-class solution had the lowest Bayesian information criterion, but one class contained only 3.2% of participants. The researchers selected a three-class solution because it offered a stronger balance of fit and interpretability. One class, representing 8.45% of the sample, began with relatively low identity, rose sharply during middle school and then plateaued. A much larger class of 84.46% showed only modest middle-school growth followed by no significant high-school change. The remaining 7.09% began highest and declined significantly in both stages, with a slightly larger estimated decline after entering high school.
Latent transition analysis shifts the target from continuous trajectories to membership in discrete states at each measurement occasion. Rather than directly estimating rates of change in the repeated outcome score, it uses the four item responses to define latent states and then estimates the probabilities of moving between them. Separate latent profile analyses at the six waves provided candidate state structures, which were then compared within longitudinal models fitted with depmixS4. A four-state model fit better than the three-state model, but the extra state mainly subdivided the low-identity group rather than revealing a qualitatively different response pattern. The retained three-state solution represented low identity at 36.9% of participants, moderate identity at 47.1% and high identity at 16.1%.
The estimated transitions showed that identity states became more persistent during high school. The probability of remaining in the moderate state rose from 0.72 to 0.78 across the middle- and high-school periods, while persistence increased from 0.51 to 0.53 for the high state and from 0.58 to 0.67 for the low state. Movement was concentrated toward the middle state: transitions from high to moderate identity increased from 0.39 to 0.42, and low-to-moderate transitions remained frequent at 0.38 and 0.31. Direct movement between the low and high states was negligible. These transition estimates describe the model’s longitudinal structure; they do not demonstrate that entering high school caused the shifts, because the educational boundary was also the designated changepoint and the analysis was observational.
The tutorial’s central lesson is that model choice determines which feature of development becomes most visible. Piecewise multilevel modeling treats individual variation as continuous around an average segmented trajectory. Piecewise latent class growth modeling instead represents heterogeneity as a finite set of trajectory groups. Latent transition analysis treats identity at each occasion as a categorical latent state and models movement between states over time. None of the three automatically replaces the others. A question about average change, distinct developmental pathways or changing state membership calls for a correspondingly different model, while researchers may combine them when a substantive question requires several views of the same longitudinal process.
Complexity brings practical constraints. The authors note that latent class models generally demand larger samples as classes become more numerous, separation weakens and missingness increases; cited recommendations range from roughly 200 participants for two-class solutions to about 1,000 for five-class solutions. Latent transition models also require adequate numbers of measurement waves, transition parameters and participants, with published guidance commonly recommending 300 to 1,000 participants and at least 500 for many applications. Missing data can be addressed in R through multiple imputation, while covariates can be added to examine variation in growth or transitions. The demonstrated framework is limited to theoretically or empirically specified changepoints, but piecewise models can also accommodate unknown or multiple changepoints, nonlinear stages, crossed group structures and multivariate growth processes.
For the national-identity example, the three methods tell a coherent but non-identical story. The average trajectory shifted from growth to decline, the class model showed that this summary concealed sharply rising, broadly stable and persistently declining groups, and the transition model indicated that adolescents increasingly occupied a moderate identity state while direct movement between extremes remained uncommon. Together, the results illustrate why longitudinal analysis is more than a matter of adding a breakpoint to a regression line. In an R workflow that is transparent and reproducible, statistical form can determine whether a developmental transition appears as a common turning point, a set of distinct pathways or movement among stable states.
Subject of Research: Statistical methods for stage-dependent change in longitudinal adolescent identity research
Article Title: Piecewise modeling for longitudinal psychological research: a tutorial using R
Article References: He, S., & Lee, W. (2026). Piecewise modeling for longitudinal psychological research: a tutorial using R. Frontiers in Psychology, 17, 1949552. https://doi.org/10.3389/fpsyg.2026.1949552
Image Credits: AI Generated
DOI: 10.3389/fpsyg.2026.1949552
Keywords: piecewise modeling, longitudinal psychology, latent class growth model, latent transition analysis, multilevel modeling, R software, adolescent development, national identity, South Korea, Piecewise, modeling, longitudinal
Cite Scienmag News
Glenn Wilkins. (October 22, 2026). R tutorial maps divergent adolescent identity trajectories. Scienmag. https://scienmag.com/r-tutorial-maps-divergent-adolescent-identity-trajectories/
Glenn Wilkins. "R tutorial maps divergent adolescent identity trajectories." Scienmag, 22 October 2026, https://scienmag.com/r-tutorial-maps-divergent-adolescent-identity-trajectories/. Accessed 22 October 2026.
Glenn Wilkins. "R tutorial maps divergent adolescent identity trajectories." Scienmag. October 22, 2026. https://scienmag.com/r-tutorial-maps-divergent-adolescent-identity-trajectories/


