


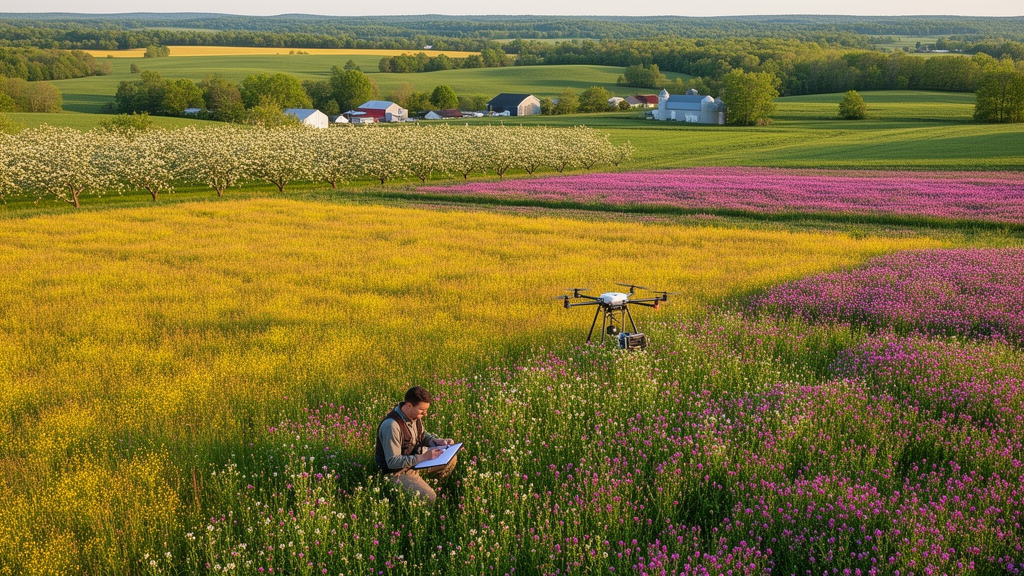
Pollinators are in trouble worldwide, and the flowers they depend on are scattered unevenly across the modern agricultural landscape. A new study published in the journal One Ecosystem presents a spatially and temporally explicit map of floral resource habitats across twelve counties of Central New York State, USA, offering researchers and practitioners a powerful new tool for understanding where and when pollinators can find nectar and pollen. The dataset, created by Kevin Li and Aaron L. Iverson with contributions from Jon R.B. Fisher and Alison G. Power, is built entirely from publicly available federal, state and non-governmental data products, stitched together at an unusually fine one-metre resolution.
The ecological logic behind the project is straightforward but consequential. Most wild pollinators, unlike honeybees, do not store large quantities of honey, so their populations are limited by the time of year when floral resources are scarcest. Some habitats, such as deciduous forests, concentrate flower production into a narrow burst, while others provide fewer resources over an extended period. Human-modified land uses complicate this picture further: mass-flowering crops concentrate flowering into an intense but limited window, urban environments can provide surprisingly important resources, and development creates new floral habitats such as roadside ditches. Any credible estimate of floral resources must therefore account for land use and land cover across a heterogeneous landscape, in both space and time.
The focal area spans Cayuga, Chemung, Cortland, Monroe, Onondaga, Ontario, Schuyler, Seneca, Tioga, Tompkins, Wayne and Yates counties, with dataset versions incorporating crop data for the years 2012 through 2019. The resulting land-cover layers allow users to quantify floral resources available within any user-specified area, for example a two-kilometre radius around the location of a bee hive. When paired with phenological data on the flowering plant communities associated with each land-cover class, users can predict pollinator floral resources over any specified period in the year.
The methodology is a carefully engineered combination of remote sensing-derived natural habitat, crop and land-use data products with roads GIS data. As a starting point, the team derived crop and other land-cover information from annual versions of the Cropland Data Layer, a raster dataset released by the US Department of Agriculture. Where that layer indicated natural vegetation, the researchers referenced the Terrestrial Habitat Map for the northeast US and Atlantic Canada, produced by The Nature Conservancy, to identify the natural habitat classification. Both layers are originally thirty-metre resolution, and mismatches between them were resolved by referring to the nearest Terrestrial Habitat class.
The land-cover classes of the final dataset aggregate crop and natural habitat classifications into categories narrow enough to capture major variation in floral characteristics yet coarse enough to allow feasible sampling with replication. Major annual and perennial crops that provide floral resources are indicated by their species. Other perennial crops are grouped together, reflecting a similar weed community resulting from the common practice of using mowed grass alleyways between crop rows. Remaining annual crop types fall into two general groups: insect-pollinated crops, which flower under cultivation, such as sunflower, and non-resource crops, which either do not produce insect-pollinated flowers ecologically, like wind-pollinated wheat, or are harvested before flowering, like broccoli. A separate winter-cover category captures non-resource crops sown in autumn to overwinter.
The real technical innovation lies in the downscaling. The team obtained one-metre resolution vegetation coverage data from the Land Cover Data Project of the Chesapeake Conservancy, a layer created from lidar data supplied by FEMA and the US Geological Survey, ortho-imagery from the National Agriculture Imagery Program, county-level planimetrics, statewide roads data and National Wetlands Inventory information. This high-resolution layer was available for nine of the twelve counties. Within it, vegetation is classified as trees or low vegetation, with additional classes for water and impervious surfaces; the researchers reclassified all impervious categories as no resource. The thirty-metre crop and habitat information was then downscaled to one-metre resolution, with wetland and waterbody delineations from the National Wetland Inventory inserted into the layer, using vegetation height classes to update wetland cells as emergent or shrub wetlands.
Roadside ditches, which can be an abundant source of floral resources for pollinators, posed a distinct challenge. Remotely sensing ditches from imagery requires very high resolution data and substantial analytical effort, so the team instead predicted likely flowering ditch locations from a New York State roads layer. Urban and suburban streets were systematically excluded: roads intersecting city and village boundaries were dropped, parking-lot roads were eliminated, and town roads lacking road in their name, such as streets, places, boulevards and avenues, were filtered out on the observation that such names denote urban streets rather than rural roads in the region. Along the remaining roads, ditches were simulated using a buffer from the road centre-line, with a width dependent on road type, assigning a ditch width of three metres, the average size in the study region, on each side. Portions intersecting water features were erased.
For the three counties without high-resolution vegetation data, Monroe, Seneca and Wayne, the team used an alternative approach to estimate lawn and urban tree coverage within developed areas. Conversion factors were calculated from the average relationship between two development intensity classes and the underlying proportion of lawn and urban tree coverage in the nine counties where one-metre data exist. Quality control was rigorous: contingency tables based on ten thousand randomly placed points compared the final land-cover class to the classes of the originating data layers. Agricultural classes were preserved with fidelity values above eighty percent, and in many cases above ninety percent, reflecting the homogeneity of agricultural areas. Natural areas showed lower fidelity, likely because these land covers are more heterogeneous and the one-metre vegetation data better reflect a mix of land-cover types. Shrubland, at forty-two percent fidelity, occurs prominently in areas classified as agricultural land in the TNC dataset, possibly indicating woody vegetation in old fields undergoing succession.
The output layers are stored as one-metre resolution rasters in the USA Contiguous Albers Equal Area Conic USGS projection, as sixteen-bit unsigned integer GeoTIFF files, with both dataset versions and the full ArcGIS ModelBuilder geoprocessing toolbox available on Zenodo under a CC BY 4.0 licence. The team also quantified the error of predicting lawn and urban tree cover in counties without high-resolution data, calculating the root mean square error between high-resolution coverage estimates and category-based predictions at one hundred randomly placed points in developed areas. Prediction accuracy improved with increasing buffer size, and the simpler category-based method is recommended over a continuous permeable-surface alternative that adds processing steps without improving accuracy.
The applications extend well beyond mapping for its own sake. The land-cover estimates can be combined with field data on flower phenology, abundance, size and community composition to understand landscape patterns in floral resources and associated bee abundance and richness over the growing season. They can also feed spatially explicit pollinator abundance models as floral availability scores. For beekeepers, the dataset offers a way to evaluate hive placements; for conservation practitioners, it can identify which habitat restoration efforts would most effectively boost native pollinator populations. The authors caution that the estimates are expected to be more accurate when aggregated over an area and should not be interpreted as a representation of on-the-ground conditions at any single pixel, and that the land-cover categories combine input classes based on similarities in flowering phenology, species composition and abundance, groupings that may not be appropriate outside this original purpose. An exhaustive field validation was beyond the scope of the project, though extensive accuracy assessments are available for many of the input layers, and the accuracy of predicted flowering ditch locations could be the subject of future research.
Subject of Research: Pollinator ecology, remote sensing and land-cover mapping in Central New York
Article Title: A map of pollinator floral resource habitats in the agricultural landscape of Central New York
Article References: Li, K., Fisher, J., Power, A., & Iverson, A. (2024). A map of pollinator floral resource habitats in the agricultural landscape of Central New York. One Ecosystem, 9, Article e118634. https://doi.org/10.3897/oneeco.9.e118634
Image Credits: AI Generated
Keywords: pollinators, floral resources, land-cover mapping, remote sensing, Central New York, One Ecosystem, bee conservation, GIS, pollinator, floral, resource, habitats
Cite Scienmag News
Margaret Porter. (October 19, 2026). Mapping the flowers that feed the bees: a 1-metre resolution floral resource atlas for Central New York. Scienmag. https://scienmag.com/mapping-the-flowers-that-feed-the-bees-a-1-metre-resolution-floral-resource-atlas-for-central-new-york/
Margaret Porter. "Mapping the flowers that feed the bees: a 1-metre resolution floral resource atlas for Central New York." Scienmag, 19 October 2026, https://scienmag.com/mapping-the-flowers-that-feed-the-bees-a-1-metre-resolution-floral-resource-atlas-for-central-new-york/. Accessed 19 October 2026.
Margaret Porter. "Mapping the flowers that feed the bees: a 1-metre resolution floral resource atlas for Central New York." Scienmag. October 19, 2026. https://scienmag.com/mapping-the-flowers-that-feed-the-bees-a-1-metre-resolution-floral-resource-atlas-for-central-new-york/


