


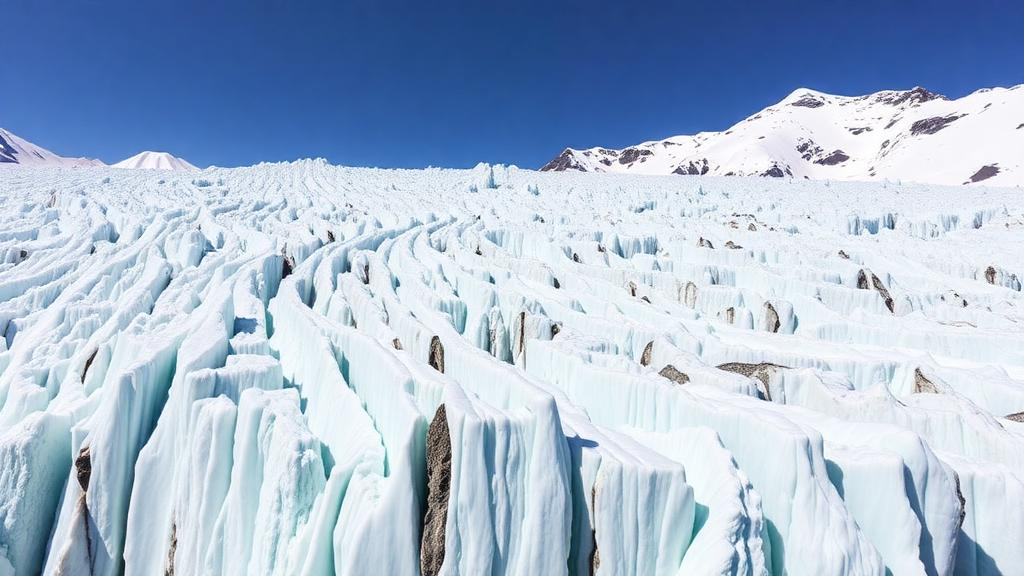
High in the Qilian Mountains of northeastern China, an ice cap called the Dunde Glacier has quietly surrendered its secrets to a team of researchers who spent the summer of 2023 measuring something rarely measured before: the invisible exchange of heat and moisture between a continental glacier and the thin, cold air above it. In a new study published in The Cryosphere, scientists led by Yichan Xu and Meilin Zhu of Lanzhou University present the first comprehensive eddy covariance analysis of turbulent heat fluxes over a continental glacier on the Tibetan Plateau, a region whose glaciers feed rivers that hundreds of millions of people depend on.
Turbulent fluxes are the atmosphere’s invisible hand on a glacier’s surface. Sensible heat flux, often written as H, describes the transfer of warmth from air to ice or vice versa, driven by the temperature difference between them. Latent heat flux, or LE, describes the energy carried by water vapor — when a glacier surface sublimates, ice turns directly to vapor and the glacier loses both mass and energy; when condensation or deposition occurs, the process reverses and the glacier gains. Together these two fluxes can account for roughly 14 to 35 percent of the energy budget of Tibetan Plateau glaciers, and they are a primary driver of sublimation-driven mass loss during the long cold season from October to May. Yet despite their importance, direct measurements over the plateau’s continental glaciers — the cold, dry, low-precipitation type that dominates the region — had never been systematically collected and analyzed until now.
The measurement site sat at 5,317 meters above sea level on the surface of the Dunde ice cap, which spans roughly 60 square kilometers between 4,400 and 5,500 meters elevation. The team deployed a Campbell IRGASON eddy covariance system that recorded three-dimensional wind components, virtual temperature, and water vapor concentration at 10 times per second from mid-May to mid-October 2023. Eddy covariance works by correlating rapid vertical wind fluctuations with simultaneous fluctuations in temperature and humidity, effectively weighing every parcel of air that crosses the sensor and tallying the heat and moisture it carries. After rigorous quality control — including coordinate rotation, density corrections following the Webb-Pearman-Leuning formulation, spectral corrections, and screening for low winds, extreme vertical velocities, and obstructed wind directions — 72 percent of the half-hourly flux data survived for analysis.
The observations painted a vivid picture of a glacier that is, on balance, losing energy to the atmosphere through turbulent exchange. The mean latent heat flux was −9.6 watts per square meter, indicating persistent sublimation throughout the study period, while the mean sensible heat flux was +6.9 watts per square meter, showing that the air generally warmed the ice. The latent heat term dominated in magnitude: daily mean LE ranged from −35.9 watts per square meter in late August to +10.4 watts per square meter in mid-July, and its absolute value was strongest in May and June at −15.1 watts per square meter on average. Because sublimation outweighed heat gain, the total turbulent flux averaged −2.9 watts per square meter — a net energy loss from the glacier surface. The team also documented a persistent near-surface temperature inversion, with air temperature exceeding surface temperature by an average of 1.4 degrees Celsius, a signature of the stable boundary layer that forms over cold ice.
With this observational benchmark in hand, the researchers put five widely used turbulent flux parameterizations to the test. The simplest, called C_log, applies a constant exchange coefficient driven by near-surface wind speed without any atmospheric stability correction — computationally cheap but blind to the nighttime surface inversions that characterize glacier climates. The C_kat method, derived from a simplified katabatic flow model, explicitly accounts for the glacier winds that drain cold air down the ice surface but lacks dynamic stability adjustments. Two methods, CRib1 and CRib2, use the bulk Richardson number — a dimensionless ratio of buoyancy to mechanical shear — to damp turbulent exchange under stable stratification. The most sophisticated, C_M–O, implements full Monin–Obukhov similarity theory with universal stability functions solved iteratively. For the observation-based schemes, the team derived a representative momentum roughness length of 1.2 × 10⁻⁴ meters from the eddy covariance data itself, and tested two alternative parameterizations of scalar roughness lengths for heat and vapor transfer, known as A87 and SvdB.
The verdict, across daily, seasonal, and diurnal timescales, favored the Richardson-number-based approaches. All five schemes captured the broad temporal evolution of the fluxes, but most systematically underestimated them, particularly during periods of abrupt change in early and mid-July and mid-August. For latent heat flux, root mean square errors ranged from 11.2 to 13 watts per square meter across most configurations, while sensible heat flux was simulated more accurately, with RMSE values of 3.5 to 4.1 watts per square meter for the Richardson-number methods. At the diurnal scale, CRib1 and CRib2 most faithfully reproduced the observed rhythm — latent heat peaking around 15:30 local time, sensible heat reaching its minimum near noon and maximum around 23:00. The SvdB scalar roughness parameterization consistently outperformed A87, especially during high-flux periods. The katabatic-wind-based C_kat method, despite having its empirical parameters recalibrated against the observations, performed worst overall.
The team then embedded three representative schemes — C_log, CRib2, and C_M–O with SvdB — into a coupled energy balance and snow-firn model to see how parameter choices ripple through to simulated glacier behavior. Using original published parameter values, the models produced surface temperature errors as large as 8.8 degrees Celsius RMSE and cumulative mass balance estimates that deviated markedly from an observation-constrained reference of −298.6 millimeters water equivalent. After recalibrating the turbulent flux parameters against the eddy covariance data, all three schemes improved: the CRib2 configuration showed the largest gains, cutting its surface temperature RMSE by 68.2 percent and its surface height error by 16.7 percent, while its cumulative mass balance error dropped 17.6 percent. The independently measured stake-based mass balance of −303 millimeters water equivalent closely matched the reference simulation, lending confidence to the evaluation framework.
Perhaps the most striking finding came from a four-day humid heatwave in early July 2023, when mean air temperature surged to 2.4 degrees Celsius — nearly 4 degrees above the non-heatwave July average — and relative humidity climbed to 94.3 percent. During this event, sensible heat flux more than doubled to a daily average of 17.5 watts per square meter, while the magnitude of the negative latent heat flux collapsed from −25.2 to −3.1 watts per square meter, and on July 11 it actually reversed direction, becoming positive at +5.1 watts per square meter as condensation or deposition replaced sublimation. The total turbulent flux flipped from a net loss of −13.8 watts per square meter during normal July conditions to a net gain of +14.4 watts per square meter during the heatwave — a complete sign reversal that accelerated surface melt, promoted snow metamorphism, and lowered surface albedo by exposing underlying ice. Such weakly negative or positive latent heat fluxes are normally seen over maritime glaciers or in the high-latitude Arctic, not atop a cold continental ice cap.
None of the five parameterizations fully reproduced this heatwave behavior. All schemes captured the surge in sensible heat flux — CRib1 and C_M–O with SvdB performing best at 16.7 and 16.4 watts per square meter respectively — but every method substantially overestimated the magnitude of latent heat flux during the event and failed to reproduce its occasional sign reversal. The authors attribute part of this gap to the half-hourly averaging of the driving meteorological data, which can obscure short-lived near-surface gradients, but the discrepancy also points to a genuine structural limitation: current bulk formulations struggle to represent latent heat exchange when warm, humid air sits over a melting surface whose temperature is capped at zero degrees Celsius. As the Tibetan Plateau continues to warm and moisten, such humid heatwaves are projected to become more frequent and intense, potentially pushing continental glaciers toward turbulent flux regimes more typical of maritime ice.
The study also contributes a valuable observation on surface roughness. The quality-controlled momentum roughness lengths derived from the eddy covariance data spanned five orders of magnitude, from 1.14 × 10⁻⁵ to 2.08 × 10⁻² meters, with a median of 1.2 × 10⁻⁴ meters. Comparing these values with published estimates, the authors note that continental glaciers on the Tibetan Plateau tend to exhibit broader ranges and generally lower characteristic roughness lengths than maritime glaciers, whose reported values cluster between 10⁻⁴ and 10⁻² meters. This systematic difference matters because roughness length directly controls the turbulent exchange coefficient, and using inappropriate values can bias flux estimates substantially. For a region often called the Asian Water Tower, where glacier meltwater sustains major river systems, closing this observational gap is not an academic exercise — it is a prerequisite for forecasting how the plateau’s frozen reservoirs will respond to a warming, and increasingly humid, future climate.
Subject of Research: Turbulent heat flux observations and parameterization evaluation over the Dunde Glacier on the Tibetan Plateau
Article Title: Evaluation of turbulent flux parameterizations over a continental glacier on the Tibetan Plateau
Article References: Xu, Y., Zhu, M., Gao, J., Lin, D., Hui, L., Zhu, F., Zhao, H., & Zhang, F. (2026). Evaluation of turbulent flux parameterizations over a continental glacier on the Tibetan Plateau. The Cryosphere, 20(10), 6021-6044. https://doi.org/10.5194/tc-20-6021-2026
Image Credits: AI Generated
Keywords: Tibetan Plateau, Dunde Glacier, turbulent heat flux, eddy covariance, surface energy balance, glacier mass balance, Monin-Obukhov similarity theory, bulk Richardson number, aerodynamic roughness length, humid heatwave, sublimation, The Cryosphere
Cite Scienmag News
Sloane Callahan. (October 16, 2026). First direct measurements reveal how heat and moisture flow over a Tibetan Plateau glacier. Scienmag. https://scienmag.com/first-direct-measurements-reveal-how-heat-and-moisture-flow-over-a-tibetan-plateau-glacier/
Sloane Callahan. "First direct measurements reveal how heat and moisture flow over a Tibetan Plateau glacier." Scienmag, 16 October 2026, https://scienmag.com/first-direct-measurements-reveal-how-heat-and-moisture-flow-over-a-tibetan-plateau-glacier/. Accessed 16 October 2026.
Sloane Callahan. "First direct measurements reveal how heat and moisture flow over a Tibetan Plateau glacier." Scienmag. October 16, 2026. https://scienmag.com/first-direct-measurements-reveal-how-heat-and-moisture-flow-over-a-tibetan-plateau-glacier/


