


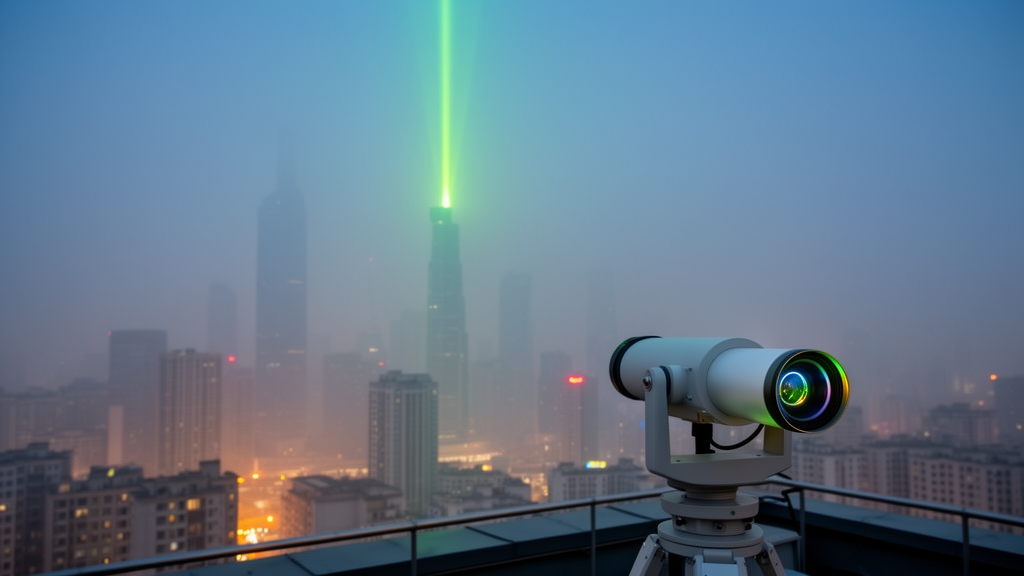
For decades, air-quality scientists have faced an awkward blind spot: the pollution that matters most to human lungs does not sit politely at the ground, where monitoring stations can measure it. Fine particulate matter, known as PM2.5 because its particles are 2.5 micrometers across or smaller, builds up, drifts, and dissipates in layers hundreds of meters above city streets. Ground networks capture only the bottom of that story. Satellites, meanwhile, see the whole atmospheric column but cannot resolve where within it the pollution actually resides. A new study published in Atmospheric Measurement Techniques by Siying Chen, Yingjie Shu, Pan Guo, and colleagues at the Beijing Institute of Technology closes part of that gap with a laser-based technique that not only profiles PM2.5 with height but also knows, in a meaningful optical sense, what kind of particles it is looking at.
The core problem the team attacked is deceptively simple to state. Lidar instruments fire laser pulses into the sky and measure the light scattered back by air molecules and particles. From that return signal, researchers can compute the aerosol extinction coefficient, a measure of how strongly the atmosphere attenuates light at each altitude. Since the early 2010s, several groups have exploited an empirical fact: under relatively uniform urban haze, extinction correlates roughly linearly with PM2.5 mass concentration. Fit a straight line between near-surface extinction and ground-station PM2.5 readings, then apply that line to the full vertical profile, and you obtain a PM2.5 concentration at every altitude the lidar can see. It is elegant, cheap, and widely used from Tianjin to Beijing for studying pollution transport and boundary-layer dynamics.
But the linear assumption hides a systematic trap. The extinction coefficient is an optical quantity, and it responds to all particles, not just the fine ones that define PM2.5. Coarse-mode mineral particles, such as desert dust lofted from the Mongolian Gobi or resuspended urban dust, scatter plenty of light per unit of their mass budget yet contribute almost nothing to the PM2.5 fraction, because their mass sits overwhelmingly in the PM10 size range. Their mass extinction efficiency, the extinction delivered per unit mass concentration, is significantly lower than that of fine-mode anthropogenic pollution aerosols. When a lidar profile contains a mix of fine pollution and coarse dust, plugging the total extinction into a PM2.5 conversion recipe inflates the fine-particle estimate. In North China during autumn and winter, where dust transport and urban haze routinely coexist, that inflation is not a marginal nuisance; it is a structural bias baked into the retrieval.
Chen and colleagues’ solution rests on two optical fingerprints measured simultaneously by their fluorescence-Raman-Mie polarization lidar, an instrument developed by the same group and stationed at the Zhongguancun campus of Beijing Institute of Technology. The first fingerprint is the particle depolarization ratio, which quantifies how much the backscattered light depolarizes, a property tied to particle shape. Spherical pollution droplets depolarize light weakly; nonspherical mineral grains depolarize it strongly. The second, and more novel, fingerprint is fluorescence capacity, defined as the ratio of fluorescence backscatter to elastic backscatter. When the 355-nanometer ultraviolet laser strikes particles containing fluorescent organic compounds, the particles re-emit light at longer wavelengths, and the instrument’s fluorescence channel captures it. Because organic aerosol can make up 30 to 50 percent of PM2.5 mass during heavy haze episodes, pollution particles glow measurably, while mineral dust barely fluoresces at all.
Combining these two parameters creates a two-dimensional classification space that neither parameter alone can provide. The team adopted the depolarization-fluorescence framework established in earlier Beijing observations and sorted every lidar measurement into three classes: anthropogenic pollution aerosols, desert dust, and mineral dust. The distinction matters because dust particles that have aged and mixed with pollution during transport become rounder, driving their depolarization ratio down into the pollution range. Depolarization alone would misclassify them; adding fluorescence separates the glowing pollution particles from the dark mineral ones. For mixed samples, the researchers solved a small system of equations, using pure-component depolarization and fluorescence end-members, to estimate what fraction of the backscatter each aerosol type contributes, then allocated the extinction accordingly so that only the pollution-related portion fed the PM2.5 conversion.
To test whether this classification actually improves the numbers, the team built three linear retrieval models differing only in how training samples were screened. Model A used all samples with no aerosol-type constraint. Model B applied a depolarization-only filter, accepting samples with depolarization ratios between 0.10 and 0.17. Model C, the full method, selected only pollution-dominated samples identified jointly by depolarization and fluorescence. Each model was trained on its own screened dataset and then validated against 411 hourly near-surface samples from 69 observation dates that no model had seen during training, matched against measurements at the Wanliu air-quality monitoring station roughly 3 kilometers from the lidar site.
The results were striking. Model A, the unconstrained baseline, produced a root-mean-square error of 28.04 micrograms per cubic meter and a mean bias of 19.42, a substantial systematic overestimate exactly as the coarse-particle contamination argument predicts. Model B improved matters, cutting RMSE to 25.42, but still carried a positive bias of 15.22, showing that depolarization screening alone cannot fully exclude mixed aerosols and aged dust. Model C delivered an RMSE of 17.32, a mean absolute error of 13.54, and a bias of just 3.30 micrograms per cubic meter. Relative to the unconstrained model, the RMSE fell by 38.2 percent, the MAE by 45.0 percent, and the bias by roughly 83 percent. Relative to depolarization-only screening, RMSE and MAE dropped by 31.9 and 38.7 percent respectively. The mean predicted concentration, 48.18 micrograms per cubic meter, landed close to the observed mean of 44.88.
The method’s real payoff came in a case study from 6 November 2024, when Beijing’s atmosphere staged a textbook transition from mixed aerosols to pure pollution. During the early evening hours, desert dust dominated the layer between roughly 1.1 and 1.5 kilometers, arriving on northwesterly winds of 6 to 8 meters per second from the Mongolian Gobi and Inner Mongolia, as backward-trajectory analysis confirmed. Below, winds from the southwest carried industrial and urban air from the North China Plain. After about 13:30 UTC, the pollution fraction surged, and a high-PM2.5 layer developed between 0.8 and 1.2 kilometers, intensifying from roughly 25 to 35 micrograms per cubic meter and eventually peaking near 42. When the researchers compared retrievals with and without classification constraints over the 0.8 to 1.5 kilometer range, the unconstrained version ran systematically higher by a median of 20.8 micrograms per cubic meter, with every single paired difference positive, a clean signature of dust extinction masquerading as fine-particle mass.
Crucially, the retrieved vertical structure proved physically coherent with independent meteorology. As the temperature inversion layer strengthened and descended toward 1.4 to 1.5 kilometers during the evening, the pollution layer thickened and its top rose in step, consistent with stable stratification suppressing vertical mixing and trapping pollutants. On the following day, when pollution aerosols dominated outright, the PM2.5 layer compressed when mid-level winds strengthened to 10 to 14 meters per second and re-expanded when winds weakened, its top tracking the base of the stable layer throughout. Uncertainty analysis, using Monte Carlo perturbations of classification end-members and aerosol-type-dependent lidar ratios across 100 realizations, showed that these classification choices shift the quantitative estimates but do not overturn the vertical structure of the pollution layers; the dominant uncertainty instead comes from scatter in the empirical extinction-to-PM2.5 relationship itself.
The authors are candid about limits. The validation compares a lidar layer at 450 to 600 meters altitude with surface monitors, not a true independent profile measurement, and no synchronous chemical-composition or humidity-profile data were available to refine the classification thresholds dynamically. Season-specific fitting offered no consistent improvement, and the model parameters are calibrated to Beijing’s aerosol mix, so other regions or seasons would require local recalibration. Still, the demonstration that a single ground-based instrument can simultaneously classify aerosols by shape and fluorescence and convert that classification into markedly more accurate vertical PM2.5 profiles marks a genuine advance. As cities across the dust-belt of Asia and beyond grapple with pollution episodes whose vertical structure determines whether haze accumulates or disperses, lidar that knows what it is looking at may become the observational backbone of the next generation of air-quality science.
Subject of Research: Retrieval of vertical PM2.5 concentration profiles from fluorescence-Raman-Mie polarization lidar using aerosol-type classification constraints
Article Title: Classification-constrained retrieval of PM2.5 vertical profiles from fluorescence-raman-mie polarization lidar
Article References: Chen, S., Shu, Y., Chen, H., Guo, P., Jiang, Y., Hu, G., Zhang, X., Yang, H., Feng, M., Cao, Y., & Zhang, K. (2026). Classification-constrained retrieval of PM 2.5 vertical profiles from fluorescence-raman-mie polarization lidar. Atmospheric Measurement Techniques, 19(20), 6517-6534. https://doi.org/10.5194/amt-19-6517-2026
Image Credits: AI Generated
Keywords: PM2.5, lidar, aerosol classification, fluorescence lidar, depolarization ratio, Beijing air quality, atmospheric remote sensing, desert dust, anthropogenic pollution aerosols, boundary layer, extinction coefficient, Atmospheric Measurement Techniques
Cite Scienmag News
Russell Cooper. (October 16, 2026). Lidar That Knows What It Is Looking At Cuts Beijing PM2.5 Profile Errors by 38 Percent. Scienmag. https://scienmag.com/lidar-that-knows-what-it-is-looking-at-cuts-beijing-pm2-5-profile-errors-by-38-percent/
Russell Cooper. "Lidar That Knows What It Is Looking At Cuts Beijing PM2.5 Profile Errors by 38 Percent." Scienmag, 16 October 2026, https://scienmag.com/lidar-that-knows-what-it-is-looking-at-cuts-beijing-pm2-5-profile-errors-by-38-percent/. Accessed 16 October 2026.
Russell Cooper. "Lidar That Knows What It Is Looking At Cuts Beijing PM2.5 Profile Errors by 38 Percent." Scienmag. October 16, 2026. https://scienmag.com/lidar-that-knows-what-it-is-looking-at-cuts-beijing-pm2-5-profile-errors-by-38-percent/


