


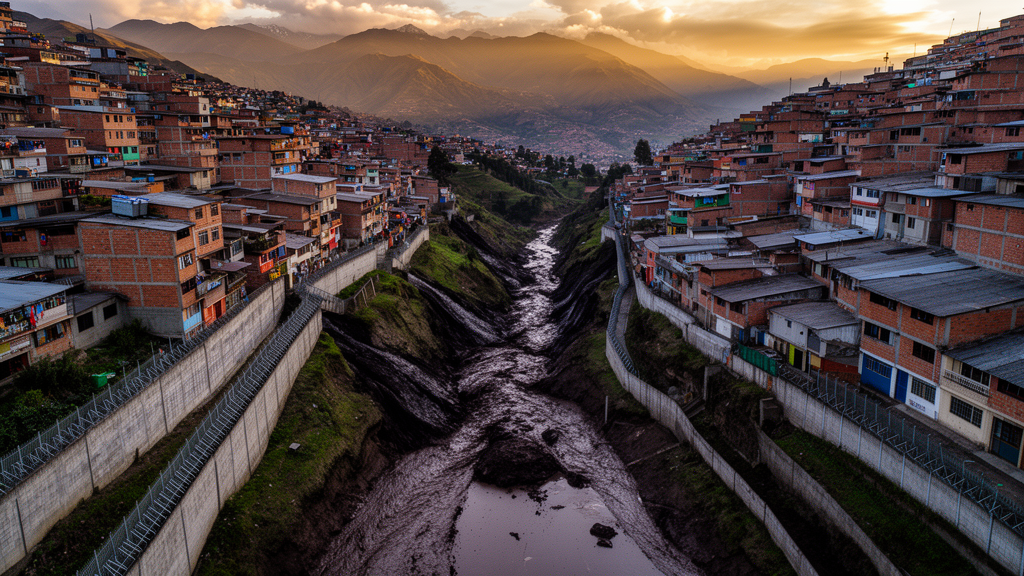
On the evening of 31 January 2022, a mudflow estimated at roughly 46,000 cubic metres tore through the La Gasca and La Comuna neighbourhoods of Quito, Ecuador, killing 28 people, injuring 52, and leaving one person missing. Seven homes collapsed, 27 were declared uninhabitable, and 14 suffered partial structural failure, particularly in the perimeter brick walls that line the city’s dense urban blocks. The disaster was one of the most devastating climate-related events in the Ecuadorian capital’s recent history, and it exposed a gap that hazard scientists have long struggled to close: how to simulate fast-moving sediment flows through a city where buildings, walls, streets, and even parked cars can redirect, channelize, or block the flow. Now, a team led by Francisco J. Vasconez of the Instituto Geofísico at Escuela Politécnica Nacional and the University of Bristol has shown that the answer lies not in the most detailed elevation map available, but in a carefully curated one. Their findings, published in the journal Natural Hazards, demonstrate that urban topography exerts a first-order control on where a mudflow goes, far more than on how much material it mobilizes.
The study focused on the El Tejado basin, one of dozens of steep gullies that descend from Ruku Pichincha, the oldest edifice of the Pichincha Volcanic Complex. The basin stretches from approximately 4,000 metres above sea level at its source down to 2,970 metres at its urban outlet, covering 7.2 square kilometres with an average slope of 33 percent. Quito itself, home to over 2.8 million inhabitants, has expanded dramatically in the past 34 years, growing from roughly 160 to 352 square kilometres as new developments encroach on surrounding hillsides. This rapid expansion has placed more people directly in the path of the gullies that serve as natural drainage pathways during intense rainfall. A historical precedent occurred in 1975, when a mudflow of approximately 52,000 cubic metres descended through the same ravine and caused severe damage in La Gasca. Despite mitigation works implemented by the municipality from the late 1990s through the early 2000s, destructive flows struck again in 2022 and 2024, underscoring the urgent need for improved understanding of mudflow behaviour in densely urbanised settings.
To capture the urban fabric in sufficient detail, the researchers conducted an Uncrewed Aerial Vehicle survey just two days after the 2022 event, covering 6.3 square kilometres along the El Tejado ravine and the La Gasca–La Comuna urban sector. Using a DJI Matrice 210 quadcopter equipped with a 20-megapixel camera, they acquired 874 images at an average flying height of roughly 310 metres above ground level, yielding a ground sampling distance of 8.3 centimetres. Structure-from-motion processing in Pix4Dmapper produced a point cloud of 89.3 million points and a Digital Surface Model at 50 centimetres per pixel. This high-resolution surface captured everything present at the time of acquisition: buildings, fences, tunnels, cars, trees, and even people. The team then constructed four distinct topographic representations to test how each would influence simulated flow behaviour. The first was a bare-earth Digital Terrain Model, or DTM, in which all surface features were filtered out to approximate the underlying terrain. The second was the full Digital Surface Model, or DSM, retaining every feature captured during the survey. The third and fourth were partial DSMs in which permanent urban elements were selectively reintroduced: one added building footprints from the Google Open Buildings dataset, while the other incorporated property boundaries from the official Quito cadastral database, representing the brick fences and walls that typically stand two to three metres high in the study area.
The simulations were run using Kestrel, a physics-based shallow-layer flow model parameterised as LaharFlow, which treats debris flows as concentrated sediment-water mixtures moving over complex topography. A key strength of the model is its morphodynamic coupling, whereby erosion and deposition actively modify the bed surface during flow propagation, a feedback that strongly influences flow routing and runout. The researchers released only water at the source, allowing sediment to be progressively incorporated downstream through erosion and entrainment computed by the morphodynamic scheme. The total mobilized volume was therefore an outcome of the simulation rather than an input. All four topographic scenarios shared identical parameter values, calibrated previously for the well-documented 2015 Calbuco lahars in Chile, so that any differences among scenarios could be attributed to the topographic representation alone rather than to parameter uncertainty. Each simulation ran for one hour on a 2-metre computational grid, requiring approximately 15 hours of runtime on a high-performance cluster with 276 physical CPU cores.
The results were striking. The bare-earth DTM systematically produced the lowest flow depths and speeds, reflecting the absence of flow-constraining urban elements, but it also allowed the flow to spread unrealistically into areas that were never inundated during the real event. The DTM overestimated the inundated area by approximately 2.5 times compared with the observed extent of 122,791 square metres. Conversely, the full DSM produced the smallest inundation footprint but the greatest maximum flow depths, because transient obstacles such as vehicles, trees, and particularly the unmodified roof of a tunnel beneath Mariscal Sucre Avenue acted as artificial barriers that promoted damming and flow ponding. The tunnel, which was channelized by the real flow to depths of approximately 3 metres, remained in the photogrammetric surface as a solid, indestructible obstruction in the full DSM, causing the simulated flow to pond upstream until the obstacle was overtopped. This localized impoundment also generated the largest spurious sediment entrainment, approximately 30 percent greater than that simulated for the best-performing scenario.
Among the four configurations, the partial DSM incorporating property boundaries, or fences, performed best. It achieved approximately 75 percent true positives in spatial overlap with the observed inundation extent, the lowest underestimation at 25.2 percent, and an F1 score of 0.6, a value classified as acceptable to fair in flood and debris-flow inundation mapping, particularly in complex urban environments. This scenario also most frequently reproduced observed deposit thicknesses, matching 11 out of 21 field-measured locations, and performed well against flow speed estimates derived from video footage. The DTM yielded a moderate recall but suffered from extremely high overestimation of 179.3 percent, resulting in a low precision and an F1 score of just 0.3. The full DSM produced the poorest overlap with observations, with only 43.3 percent true positives and the highest underestimation. The DSM-buildings scenario provided intermediate performance with an F1 score of 0.5.
Perhaps the most important finding concerns the volume budget. Across all four scenarios, the total mobilized volume ranged from 50,900 to 57,000 cubic metres, differing by only 10 to 23 percent from the independent field-based estimate of 46,219 cubic metres derived by Troncoso and colleagues from flood footprints preserved on buildings and walls. Yet the simulated inundation area varied by nearly a factor of two, from 153,228 square metres for the full DSM to 302,572 square metres for the DTM. This contrast demonstrates that urban topography primarily controls where the flow propagates rather than how much material is mobilized. The researchers emphasize that accurate topographic representation matters more than volume calibration for reproducing urban inundation patterns, a conclusion with significant implications for how hazard models should be constructed and validated in cities.
Using the best-performing DSM-fences scenario as a reference, the team quantified potential structural impact pressure and human vulnerability to flow drag. Impact pressure, computed as the sum of hydrostatic and hydrodynamic components, reached its highest values in the upstream sector and progressively decreased downstream. Streets aligned with the main flow direction exhibited systematically higher pressures than orthogonal streets, reflecting enhanced flow confinement and channelization within the urban grid. Zones classified as severe damage potential, corresponding to pressures between 35 and 90 kilopascals, were restricted to N24C and Núñez de Bonilla streets, a spatial pattern consistent with field observations from the 2022 event during which seven houses were destroyed in the same area. Human instability, evaluated using a depth-velocity squared criterion originally developed for clear-water floods, predicted widespread exceedance of the sliding threshold along streets including N24C, Núñez de Bonilla, La Gasca, and Alonso de Mercadillo, closely mirroring the documented impacts that resulted in 28 fatalities.
The simulations also revealed critical timing information for early warning systems. In the DSM-fences scenario, the mudflow reaches the urban area approximately 15 minutes after initiation, corresponding to an average propagation speed of about 2.7 metres per second. Downstream, flow velocities decrease to approximately 1.6 metres per second, and the flow travels roughly 5.5 kilometres within one hour. Once the flow enters the city, its propagation becomes increasingly controlled by the street network, with preferential routing along major roads including La Gasca, América, 10 de Agosto, and Colón. Arrival times may differ by several tens of minutes across the affected area, meaning that inundation does not occur simultaneously throughout the city. A warning system based solely on detecting the flow after it has entered the urban area would provide very limited time for response. The researchers suggest that rainfall monitoring could offer a more promising component: both the 2022 and 2024 events were preceded by cumulative rainfall exceeding approximately 40 millimetres, a value that could serve as a potential pre-alert indicator, though more data and additional flow events are required to establish robust operational thresholds.
The study’s broader message is that more topographic detail does not necessarily produce better predictions. The full DSM, despite capturing every surface feature present during the survey, performed worse than a simplified partial DSM because transient objects introduced physically inconsistent barriers that disrupted flow pathways. The researchers argue that an elevation model should be regarded as one component of the hydraulic representation of a city rather than as a complete description of urban flow pathways. Their feature-selective methodology, combining relatively low-cost UAV surveys with open-access building and cadastral datasets, provides a practical and reproducible alternative to expensive LiDAR acquisitions while retaining the urban structures most likely to control flow propagation. As unplanned urban expansion continues to intersect with steep drainage basins and extreme rainfall events intensify under climate change, the findings offer a clear path forward for cities exposed to mudflow hazards: carefully curated topographic representations, updated as infrastructure changes, are essential for credible hazard assessment, early warning, and mitigation planning in densely built environments.
Subject of Research: Natural Hazards
Article Title: The role of Urban topography when simulating mudflows: a case study of Quito, Ecuador
Article References: Vasconez, F. J., Ventura-Cruz, J., Andrade, S. D., Estévez, S., Watson, C. S., & Woodhouse, M. J. (2026). The role of Urban topography when simulating mudflows: a case study of Quito, Ecuador. Natural Hazards, 122(22), Article 675. https://doi.org/10.1007/s11069-026-08442-w
Image Credits: AI Generated
DOI: 10.1007/s11069-026-08442-w
Keywords: mudflow, Quito, urban topography, debris flow, UAV photogrammetry, hazard simulation, Kestrel, LaharFlow, Ecuador, flood modelling, role, Urban
Cite Scienmag News
Violet Maxwell. (October 16, 2026). Fences Beat Full Maps: Why Urban Topography Decides Where Mudflows Go in Quito. Scienmag. https://scienmag.com/fences-beat-full-maps-why-urban-topography-decides-where-mudflows-go-in-quito/
Violet Maxwell. "Fences Beat Full Maps: Why Urban Topography Decides Where Mudflows Go in Quito." Scienmag, 16 October 2026, https://scienmag.com/fences-beat-full-maps-why-urban-topography-decides-where-mudflows-go-in-quito/. Accessed 16 October 2026.
Violet Maxwell. "Fences Beat Full Maps: Why Urban Topography Decides Where Mudflows Go in Quito." Scienmag. October 16, 2026. https://scienmag.com/fences-beat-full-maps-why-urban-topography-decides-where-mudflows-go-in-quito/


