


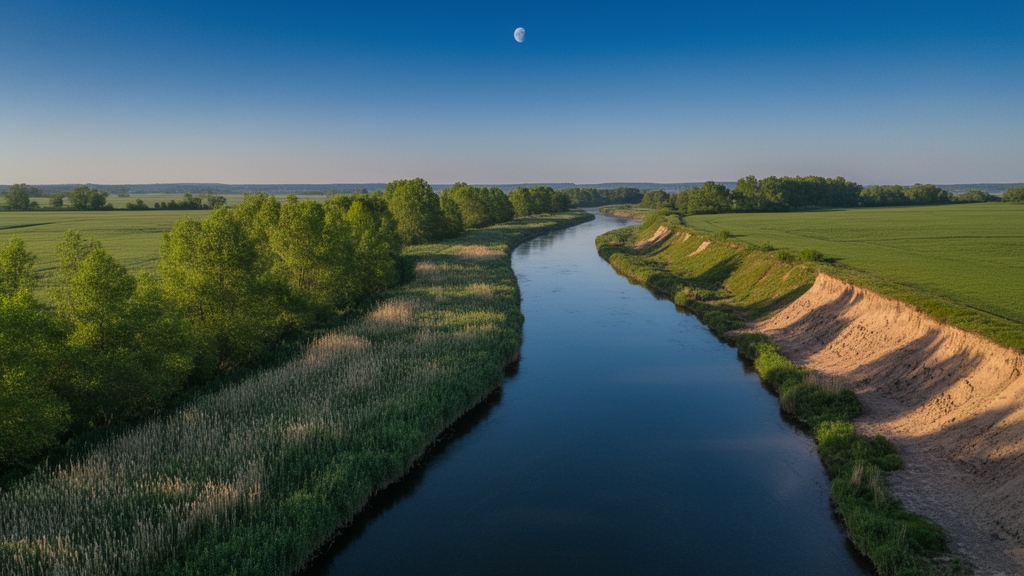
Along the edges of nearly every stream and river in farm country sits a thin ribbon of vegetation that quietly does some of the most important work in the landscape. These riparian buffer strips trap sediment, soak up nitrogen and phosphorus before they reach the water, stabilize banks, shade and cool streams, and shelter wildlife. When the buffer is degraded, the stream suffers. The trouble is that assessing these ribbons of green has always required teams of experts trudging along kilometers of watercourse, estimating land cover by eye. Now, a team of Canadian researchers has shown that a deep neural network can learn to perform that assessment directly from satellite images, potentially transforming how governments and watershed organizations monitor the health of their waterways.
The study, published in the journal Environmental Monitoring and Assessment, was conducted by Samuel de la Sablonnière, Philippe Vigneault and Etienne Lord of Agriculture and Agri-Food Canada, together with Samuel Foucher and Yacine Bouroubi of the University of Sherbrooke. Their target was the L’Acadie River watershed in southern Quebec, a 562.5 square kilometer basin where agriculture covers 67 percent of the land and rotations of maize and soybean dominate the fields. The region is a classic example of the intensively farmed lowlands where nutrient runoff threatens aquatic ecosystems. In the nearby Rivière aux Brochets watershed, for instance, annual crops contributed 69 percent of the phosphorus load in 2003 while occupying only 22 percent of the territory, a stark illustration of why the last line of defense along the water’s edge matters so much.
To measure buffer quality, the researchers relied on Quebec’s Riparian Strip Quality Index, or RSQI, a metric used for decades by provincial watershed agencies. The index is a weighted sum of the land covers found within a 10 meter wide strip along the bank: forest earns the highest weight of 10.0, shrubs 8.7, herbaceous vegetation 5.8, while crops, infrastructure and bare soil receive weights as low as 1.9 and 1.7. Values range from 17 to 100, with classes running from very poor to excellent. Traditionally, evaluators walk the streams and estimate the proportions of each cover type by hand, section by section. The COVABAR watershed organization provided exactly such a dataset for the L’Acadie River, covering 697 kilometers of watercourses surveyed between 2012 and 2015, a treasure trove of expert ground truth that most machine learning studies can only dream of.
The satellite side of the equation came from the Pléiades constellation, two optical Earth observation satellites operated by CNES and Airbus Defence and Space. Three images acquired in July 2013 and July 2015 were sharpened to a resolution of 0.5 meters using the panchromatic band, orthorectified with a LiDAR derived elevation model, and mosaicked into a single high resolution portrait of the watershed. From this mosaic, the team automatically extracted more than 46,000 small image patches, each 23 meters on a side and centered 10 meters from the nearest stream, and labeled each patch with the field measured RSQI value at that location. The patches were grouped into 3,489 riparian strips, each strip carrying a single index score that summarized conditions along its length.
That grouping posed a genuine technical puzzle. A convolutional neural network normally learns from one image paired with one label, but a riparian strip can stretch for hundreds of meters and cannot be captured in a single 46 by 46 pixel patch. The researchers’ solution was to borrow an architecture from an unexpected corner of computer vision: a Multi-View Convolutional Neural Network, or MVDCNN, originally designed to recognize three dimensional objects by looking at many snapshots of the same object from different angles. In the original design, embeddings from multiple views pass through a shared encoder and are combined in a view pooling layer. The team swapped the original VGG-M backbone for the leaner and more efficient RESNET-18, and made one ecologically motivated change: because the RSQI is itself a weighted average, they replaced the max pooling operator with an average, so the network synthesizes local assessments along the strip into a global quality estimate, mirroring how the index is actually calculated.
The team systematically tested how many views the network should see at once, trying 1, 2, 4, 8, 12 and 16 simultaneous patches per strip. Four views emerged as the sweet spot, delivering an RMSE of 7.35 and a regression slope of 0.970, closest to the ideal 1:1 line. A single view already performed surprisingly well, which the authors attribute to the relative homogeneity of agricultural riparian strips, but it systematically overestimated the worst buffers and underestimated the best ones. Beyond four views, accuracy actually declined and results became less stable, suggesting that additional patches mostly introduced redundant information. The flexibility of the multi-view design, however, means the network can accept any number of views at inference time, so the length of a river poses no practical constraint.
Perhaps the most counterintuitive finding concerned spectral bands. The researchers trained the network with seven different band combinations, from full RGB and RGB plus near infrared down to single bands repeated across all three input channels. When training from scratch, a lone green band actually beat the four band combination, and overall performance varied little across configurations. The explanation lies in texture and shape rather than color: a degraded buffer planted with crops and a pristine buffer shaded by forest can both look lush and green in a satellite image, so what distinguishes them is the pattern, texture and geometry of the vegetation, not its spectral signature. This is good news for budget conscious monitoring programs, because plain RGB imagery, the cheapest and most widely available option, works nearly as well as anything else. Fine tuning a network pre-trained on ImageNet also outperformed training from scratch by roughly 10 to 17 percent, confirming that low level features like edge and texture detection learned from everyday photographs transfer remarkably well to satellite scenes.
How does this stack up against the conventional approach? The team also computed RSQI the traditional way, using object based classification of the same imagery: segmenting the landscape into 186,936 objects, classifying them into land cover classes with a support vector machine, and then calculating the index from the classified map. That pipeline achieved an R squared of 0.87 and an RMSE of 11.25 on the 75 strip test set, respectable but clearly behind the neural network’s R squared of 0.93 and RMSE of 7.35 with RGB bands, an error reduction of about 28 percent. The conventional workflow also demands expert photo interpretation and laborious parameter tuning, whereas the trained network requires minimal preprocessing and no segmentation step at all. Simulated tests reinforced the model’s credibility: when the network was fed mixed views from two different strips, its predictions tracked the averaged index closely, and when views were synthesized along a forest to crop gradient, predicted values followed the calculated index with errors comparable to the real test set.
The authors are candid about the limitations. The model was trained on a single watershed, a single season, and a single image resolution, so applying it elsewhere would require retraining with local field data. Mid range RSQI values between 30 and 80 proved hardest to predict, likely because such strips are both rare in the dataset and genuinely heterogeneous. Dense tree canopies can hide what lies beneath them from a top down camera, a problem the authors suggest could be eased by incorporating LiDAR or radar data. And because the training labels themselves came from human evaluators working over three years with multiple teams, some subjectivity is baked into the ground truth, particularly when distinguishing natural grassland from pasture. Temporal mismatches of a year or two between field campaigns and image acquisition add further noise.
Even so, the implications are striking. This is, to the authors’ knowledge, the first direct application of deep convolutional neural networks to riparian buffer assessment, and it outperforms earlier remote sensing efforts by a wide margin, with a normalized RMSE of 0.089 compared to 0.34 in a recent European study using Sentinel 2 data. Because the method piggybacks on field campaigns that many agencies have already completed, it could enable annual, watershed wide monitoring at a fraction of the cost of repeated surveys, flagging degraded reaches for intervention and identifying regions where field campaigns are still needed. The researchers also point to a broader opportunity: if agencies make their characterization datasets publicly available, teams worldwide could build models that are more versatile and resilient, paving the way for large scale, highly recurrent monitoring of the vegetated ribbons on which so much of freshwater health depends.
Subject of Research: Deep learning-based monitoring of riparian buffer strip quality in agricultural watersheds using very high resolution satellite imagery
Article Title: A CNN-based approach to riparian buffer strip quality monitoring in agricultural areas using satellite imagery
Article References: A CNN-based approach to riparian buffer strip quality monitoring in agricultural areas using satellite imagery. (n.d.). https://doi.org/10.1007/s10661-026-15760-w
Image Credits: AI Generated
DOI: 10.1007/s10661-026-15760-w
Keywords: riparian buffers, convolutional neural networks, remote sensing, satellite imagery, water quality, RSQI, agricultural watersheds, deep learning, environmental monitoring, Pléiades, Quebec, land cover classification
Cite Scienmag News
Blake Davidson. (October 15, 2026). AI Learns to Grade Riverbank Health From Space Using Satellite Photos. Scienmag. https://scienmag.com/ai-learns-to-grade-riverbank-health-from-space-using-satellite-photos/
Blake Davidson. "AI Learns to Grade Riverbank Health From Space Using Satellite Photos." Scienmag, 15 October 2026, https://scienmag.com/ai-learns-to-grade-riverbank-health-from-space-using-satellite-photos/. Accessed 15 October 2026.
Blake Davidson. "AI Learns to Grade Riverbank Health From Space Using Satellite Photos." Scienmag. October 15, 2026. https://scienmag.com/ai-learns-to-grade-riverbank-health-from-space-using-satellite-photos/


