


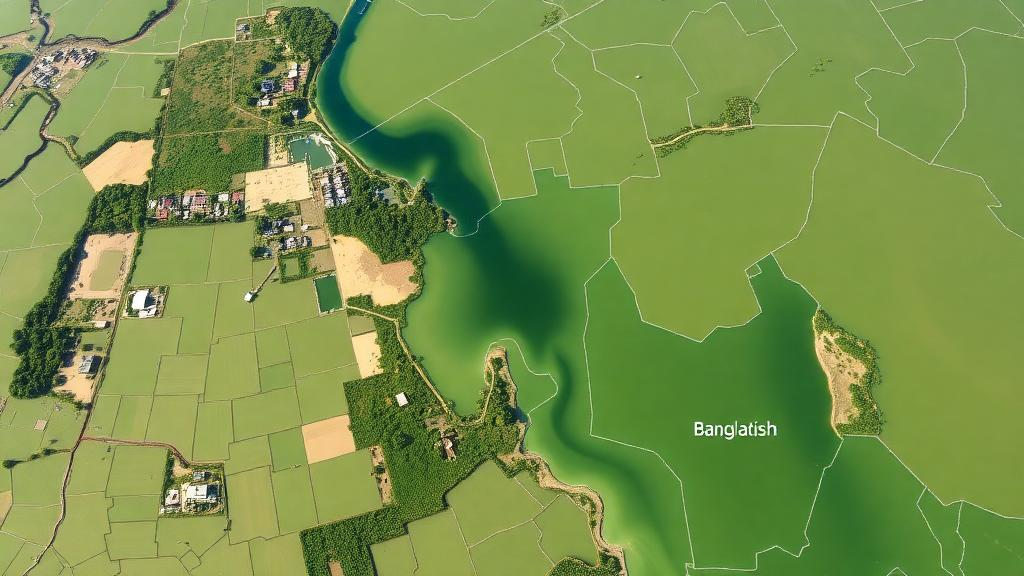
Beneath the sprawling floodplains of Chalan Beel, the largest inland wetland in Bangladesh, lies a hidden reserve of water on which millions of people, farms, and ecosystems quietly depend. A new study has now mapped, with unprecedented spatial detail, exactly where that underground water is most abundant and where it is most scarce. Combining satellite remote sensing, geographic information systems, and a structured decision-making technique known as the Analytical Hierarchy Process, researchers from the University of Rajshahi and the Bangladesh Council of Scientific and Industrial Research have produced the most comprehensive groundwater potential map yet for this ecologically vital region of northwestern Bangladesh.
The stakes could hardly be higher. Chalan Beel covers roughly 5,097 square kilometers within the Lower Atrai River Basin, spanning districts that include Natore, Pabna, and Sirajganj. The wetland and its surrounding floodplains sustain agriculture, fisheries, and biodiversity, and they act as a natural sponge that recharges aquifers during the monsoon. Yet northwestern Bangladesh is also one of the country’s most drought-prone regions, where reduced monsoon rainfall, high evapotranspiration, and intensive pumping for irrigation have driven groundwater levels downward and shrunk surface-water bodies. Knowing precisely where water can be found underground, and where it cannot, is the foundation of any plan to keep both taps and ecosystems flowing.
To build their map, the research team assembled seventeen separate thematic layers, each representing a factor that influences where groundwater accumulates and how quickly aquifers refill. These included rainfall distribution, soil type, soil permeability, groundwater levels measured in both dry and rainy seasons, aquifer depth, elevation, slope, land use and land cover, geomorphology, drainage density, distance from streams, lineament density, and satellite-derived indices of vegetation and surface water. Topographic data came from the ASTER digital elevation model at ten-meter resolution, land-surface characteristics were extracted from Landsat-8 imagery at thirty-meter resolution, rainfall surfaces were interpolated from Climatic Research Unit data, and hydrogeological measurements were supplied by the Bangladesh Water Development Board and the Bangladesh Agricultural Research Council.
Each layer was then weighted using the Analytical Hierarchy Process, a mathematical framework that compares every factor against every other factor in pairwise fashion using Saaty’s nine-point importance scale. The weights were derived through the geometric mean method, and the internal consistency of the expert judgments was verified with a consistency ratio of 0.097, just below the accepted threshold of 0.10. The result was a weighted linear combination model that fused all seventeen layers into a single groundwater recharge potential index, computed in a GIS environment and rendered as a color-coded map of the entire wetland system.
The analysis produced a clear hierarchy of influence. Rainfall emerged as the single most powerful factor, accounting for roughly 20 percent of the model’s weight, followed by soil type at 16 percent and soil permeability at 13 percent. This makes intuitive sense in a monsoon-driven delta: water enters the ground where rain falls in sufficient quantity and where the soil allows it to percolate. Mean annual rainfall across the study area ranges from about 1,210 millimeters in the west to 1,510 millimeters in the east, averaging near 1,350 millimeters, which tilts the recharge balance toward the eastern and southeastern zones. But the soil tells a more complicated story. Clay dominates 44 percent of the landscape, with silty clay covering another 33 percent and silt 15 percent, while coarse to medium sand accounts for less than 7 percent. These fine-grained floodplain sediments restrict infiltration, slow percolation, and channel more precipitation into surface runoff rather than underground storage.
The hydrogeological measurements reinforce that east-west divide. Aquifer depth ranges from roughly 16 to 30 meters below the surface, with the deepest aquifers, between 28 and 30 meters, lying in the western part of the study area and the shallowest, between 16 and 20 meters, in the east. Groundwater levels likewise fluctuate between about 5 and 8 meters below ground in the dry season, with shallow zones signaling stronger recharge and greater suitability for irrigation and domestic supply. During the monsoon months of July through October, rising precipitation lifts water tables across the basin, but the seasonal contrast is stark: approximately 83 percent of rivers and nearly 68 percent of the study area retain only a small fraction of their monsoon water extent during the dry period, sharply reducing groundwater replenishment when it is needed most.
Topography and satellite indices added further texture to the picture. Elevation across the wetland ranges from 19 meters below to 54 meters above mean sea level, and flat to gently sloping terrain covers about 97 percent of the area, conditions that slow runoff, extend the residence time of water on the land, and favor infiltration. The Topographic Wetness Index, which ranges from 2.1 to 24 across the basin, peaks in the low-lying floodplain depressions where water accumulates. The Normalized Difference Water Index shows that floodplains, covering about 51 percent of the landscape, retain high surface moisture, while wetland and degraded wetland zones show declining values that point to moisture stress, sedimentation, and agricultural encroachment. Lineament density, a measure of faults and fractures that can act as conduits for water, varies from nearly zero to 0.68 kilometers per square kilometer, with the most fractured zones offering enhanced pathways for recharge.
One of the most striking findings comes from three decades of vegetation monitoring. Analyzing the Normalized Difference Vegetation Index from 1990 to 2024, the researchers found that the moderate vegetation class increased from about 45 percent of the study area to 67 percent, a gain of roughly 22 percentage points. Meanwhile, the driest vegetation classes declined overall. Moderate vegetation cover is generally associated with optimal infiltration, because it promotes soil-water retention while limiting excessive runoff and evaporation, and previous studies have linked moderate NDVI values closely with high groundwater potential. The trend suggests improving moisture conditions across the wetland, though the wettest classes have gradually shrunk, indicating a shift from saturated conditions toward more balanced vegetation and soil-moisture regimes.
When all the layers were finally combined, the resulting map classified Chalan Beel into three groundwater potential zones. Very high potential areas cover just 65 square kilometers, about 1 percent of the study area, confined to localized settings with favorable geomorphology, gentle slopes, and permeable channel-bar deposits. Medium potential zones dominate the landscape at 3,933 square kilometers, or 77 percent, while low potential zones cover 1,099 square kilometers, or 22 percent, concentrated in clay-rich floodplains with high drainage density and restricted infiltration. Hydrograph records from twenty permanent monitoring stations added a surprising twist: while fifteen stations show the expected monsoon-driven pattern of higher water tables after the rains, five stations in the southwest display anomalously higher groundwater levels during the dry season. The researchers attribute this reversal to irrigation return flow from intensive Boro rice cultivation, surface waterlogging, and low-permeability clay-silt aquifers with discontinuous sand lenses, evidence of a powerful human fingerprint on the natural groundwater cycle.
The study’s authors are candid about its limits. The potential map was not independently validated against well-yield or borehole data, and the expert weighting inherent in the Analytical Hierarchy Process introduces uncertainty that future work should address with field measurements and data-driven modeling approaches. Even so, the framework offers an efficient and cost-effective template for groundwater assessment in data-scarce floodplain environments across South Asia and beyond. For planners in northwestern Bangladesh, the map provides a practical guide: target the shallow eastern aquifers and channel-bar deposits for sustainable extraction, protect the recharge zones from further encroachment, and manage irrigation in the areas where human activity has already rewritten the seasonal rhythm of the water table. As climatic variability intensifies and demand for water grows, that kind of spatially explicit knowledge may prove to be the most valuable resource of all.
Subject of Research: Groundwater potential zone mapping in the Chalan Beel wetland of northwestern Bangladesh using GIS, remote sensing, and the Analytical Hierarchy Process
Article Title: Delineation of groundwater potential zones in Chalan Beel (inland wetland) for sustainable ecosystem in Lower Atrai River Basin NW Bangladesh
Article References: Alam, W., Islam, I., Jahan, C. S., Hassan, M. N., Kamal, M., Tishad, F. I., Mazumder, Q. H., & Mostafa, M. G. (2026). Delineation of groundwater potential zones in Chalan Beel (inland wetland) for sustainable ecosystem in Lower Atrai River Basin NW Bangladesh. Discover Geoscience, 4(1), Article 398. https://doi.org/10.1007/s44288-026-00768-z
Image Credits: AI Generated
DOI: 10.1007/s44288-026-00768-z
Keywords: groundwater, Chalan Beel, Bangladesh, GIS, remote sensing, Analytical Hierarchy Process, wetland, aquifer, NDVI, water resources, hydrogeology, sustainable ecosystem
Cite Scienmag News
Violet Maxwell. (October 12, 2026). Satellites and GIS Reveal Where Groundwater Hides Beneath Bangladesh’s Largest Wetland. Scienmag. https://scienmag.com/satellites-and-gis-reveal-where-groundwater-hides-beneath-bangladeshs-largest-wetland/
Violet Maxwell. "Satellites and GIS Reveal Where Groundwater Hides Beneath Bangladesh’s Largest Wetland." Scienmag, 12 October 2026, https://scienmag.com/satellites-and-gis-reveal-where-groundwater-hides-beneath-bangladeshs-largest-wetland/. Accessed 12 October 2026.
Violet Maxwell. "Satellites and GIS Reveal Where Groundwater Hides Beneath Bangladesh’s Largest Wetland." Scienmag. October 12, 2026. https://scienmag.com/satellites-and-gis-reveal-where-groundwater-hides-beneath-bangladeshs-largest-wetland/


