


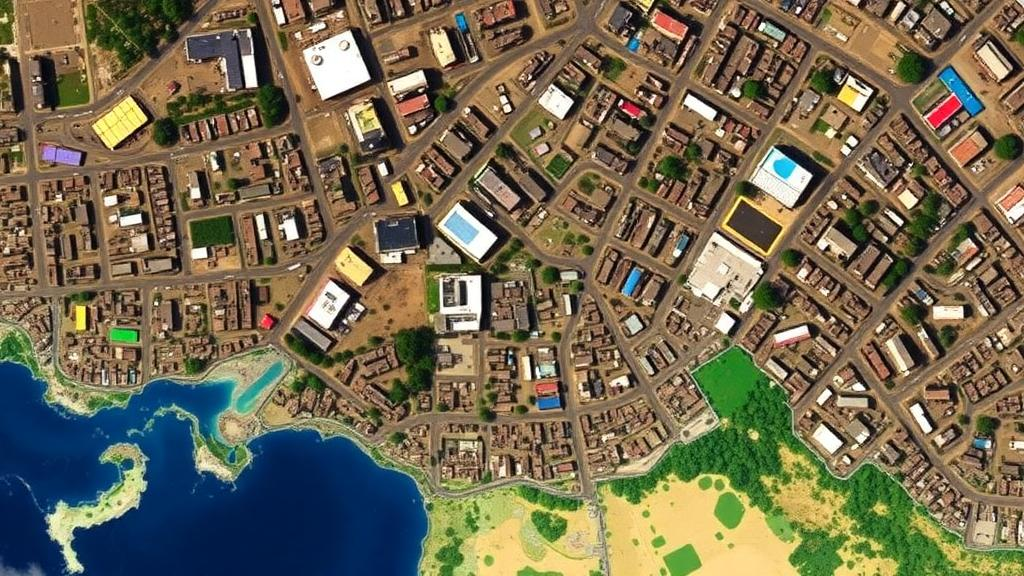
In the lowland plains of southern Nepal, a quiet transformation has been unfolding for thirty years. Migrants from the hill districts, an open border with India, and the pull of commerce have turned Rupandehi District into one of the fastest-changing landscapes in the country. Now, a team of researchers has used satellite imagery to track exactly what that growth has done to the region’s ecological health, and their findings tell a surprisingly nuanced story: despite a nearly tenfold expansion of built-up area, the district’s overall ecological quality ended the three-decade period higher than where it began, but only after passing through a troubling mid-period slump.
The study, published in Discover Geoscience, assessed ecological environmental quality in Rupandehi District from 1993 to 2023 using the Remote Sensing Ecological Index, a composite measure built entirely from openly available Landsat satellite data. The researchers, led by Gaurav Parajuli and including collaborators from the University of Kansas, Tribhuvan University, and other institutions, processed their imagery in Google Earth Engine, a cloud-based platform that makes it feasible to analyze decades of satellite data without downloading enormous archives. Their analysis code has been shared in a public repository, making the entire workflow reproducible by anyone with an internet connection.
The Remote Sensing Ecological Index, first proposed to overcome the limitations of single-indicator assessments, combines four ecological dimensions into a single score ranging from zero to one. Greenness is captured by the Normalized Difference Vegetation Index, which exploits the fact that healthy vegetation reflects near-infrared light strongly while absorbing red light. Wetness is derived from the tasseled cap transformation of satellite reflectance, a mathematical rotation of the spectral bands that isolates the moisture content of soil and vegetation. Dryness is measured by averaging a soil index and an index-based built-up index, effectively flagging impervious and barren surfaces. Heat is represented by land surface temperature, retrieved from the thermal bands of Landsat 5 and Landsat 8 using a single-channel algorithm that corrects for atmospheric radiance and surface emissivity.
Because these four indicators are measured on different scales, the team normalized each one before feeding them into a Principal Component Analysis, a statistical technique that derives variable weights from the data itself rather than relying on subjective assignments. The first principal component explained between 86 and 92 percent of the total variance in every year analyzed, an unusually stable result that confirmed the four indicators were coherently capturing a single underlying gradient of ecological quality. Crucially, the loading structure behaved exactly as theory predicts: greenness and wetness contributed positively, while heat and dryness acted as negative influences, in all four study years.
The resulting index revealed a non-linear trajectory. The district-wide mean RSEI rose from 0.59 in 1993 to 0.635 in 2004, then fell to 0.55 in 2013, before recovering to 0.67 in 2023, an overall improvement of roughly 13 percent. The mid-period decline coincided with a wave of migration from mountainous districts such as Palpa, Gulmi, and Syangja, along with road construction on the Siddhartha Highway, expanding impervious surfaces, and deforestation. Between 2004 and 2013, ecological deterioration swept across 700.82 square kilometers, about 53 percent of the study area, while only 24 percent improved. By the final decade, the balance had shifted: improvement covered 35 percent of the district and deterioration 33 percent, and the lowest quality class became virtually nonexistent by 2023.
Underneath the district average, the land itself was being rearranged. Built-up area expanded from just 13.32 square kilometers, less than one percent of the district, in 1993 to 156.16 square kilometers, over ten percent, in 2023. Agricultural land declined from 838.91 to 787.00 square kilometers over the same period, and water bodies shrank from 18.02 to 11.80 square kilometers. Barren land dropped dramatically, from 122.45 square kilometers to just 26.47. Forest cover fluctuated, dipping around 2013 before recovering, and ended the period with a slight net increase, a pattern the authors attribute in part to Nepal’s community forestry program, which has driven substantial forest regeneration across the Terai region.
To map these land cover classes, the researchers turned to a Support Vector Machine, a supervised machine learning algorithm that finds the optimal hyperplane separating classes in multidimensional spectral space while maximizing the margin between them. Using 1,099 training points and 585 validation points for each of the four classification years, the classifier achieved overall accuracies ranging from 0.795 in 1993 to 0.839 in 2023, with corresponding Kappa values of 0.743 and 0.799. Water was consistently the most reliably classified category, while dry bare land beside rivers proved the most troublesome, its reflectance sometimes resembling agricultural fields or herbaceous cover, a limitation the authors acknowledge as inherent to medium-resolution imagery.
The spatial structure of ecological quality was as telling as its average value. Higher index values clustered in the forested Chure hills of the north, while the lowest values concentrated in the urban centers of Butwal and Bhairahawa, where impervious surfaces dominate and urban heat island effects are most likely; the Tinau river corridor at Butwal also has naturally sparse vegetation that lowers the index independently of urbanization. Spatial autocorrelation analysis, performed on 1,302 sampling points resampled to a one-kilometer grid to avoid inflating the statistics, yielded Global Moran’s I values between 0.391 and 0.558 across the four years. Local cluster maps showed persistent high-high clusters in the northern forests and steadily growing low-low clusters along the Siddhartha Highway corridor, confirming that ecological decline is not random but tightly bound to the geography of development.
Perhaps the study’s most important insight is what the district average conceals. When the researchers calculated the mean index value for each land cover class, forest scored highest, rising from 0.76 in 1993 to 0.87 in 2023, agricultural land held moderate to high values, and built-up areas remained consistently low throughout all thirty years. The district-wide mean stayed relatively high in 2023 partly because built-up pixels still occupy only a small share of the total area, even though their number grew nearly tenfold. In other words, ecological quality reflects the combined influence of every land cover class rather than any single one, and a district-scale average can mask severe localized degradation within rapidly urbanizing pockets.
The authors are careful about the limits of their work. The 30-meter resolution of Landsat imagery cannot resolve fine-scale ecological variation, only four indicators were used, and factors such as population density, precipitation, and economic activity were not included in the model. A single post-monsoon scene per year, chosen because monsoon clouds block optical imaging, introduces seasonal bias that multi-date composites could reduce. Still, the study offers a transferable, low-cost template for ecological monitoring in data-scarce regions, and its implications reach beyond Nepal. As the United Nations projects the global population to reach about 9.7 billion by 2050, the Rupandehi experience suggests that unplanned urban growth erodes local ecological quality even as forest regeneration and the conversion of barren land can partly offset the damage at the landscape scale, a balance that land-use planners everywhere will need to strike with their eyes on the satellites.
Subject of Research: Assessing the impact of urbanization-driven land use and land cover change on ecological environmental quality in Rupandehi District, Nepal, using the Remote Sensing Ecological Index
Article Title: Impact of urbanization driven land use and land cover change on ecological environmental quality in Rupandehi Nepal assessed using the Remote Sensing Ecological Index
Article References: Parajuli, G., Regmi, Y., Silwal, A., Parajuli, B., Pokhrel, B., Acharya, T. D., Karki, A. M., & Shrestha, S. (2026). Impact of urbanization driven land use and land cover change on ecological environmental quality in Rupandehi Nepal assessed using the Remote Sensing Ecological Index. Discover Geoscience, 4(1), Article 298. https://doi.org/10.1007/s44288-026-00650-y
Image Credits: AI Generated
DOI: 10.1007/s44288-026-00650-y
Keywords: Remote Sensing Ecological Index, urbanization, land use land cover change, ecological environmental quality, Nepal, Google Earth Engine, Landsat, Principal Component Analysis, Support Vector Machine, spatial autocorrelation, land surface temperature, community forestry
Cite Scienmag News
Violet Maxwell. (October 10, 2026). Satellites Reveal Three Decades of Ecological Ups and Downs in Rapidly Urbanizing Nepal. Scienmag. https://scienmag.com/satellites-reveal-three-decades-of-ecological-ups-and-downs-in-rapidly-urbanizing-nepal/
Violet Maxwell. "Satellites Reveal Three Decades of Ecological Ups and Downs in Rapidly Urbanizing Nepal." Scienmag, 10 October 2026, https://scienmag.com/satellites-reveal-three-decades-of-ecological-ups-and-downs-in-rapidly-urbanizing-nepal/. Accessed 10 October 2026.
Violet Maxwell. "Satellites Reveal Three Decades of Ecological Ups and Downs in Rapidly Urbanizing Nepal." Scienmag. October 10, 2026. https://scienmag.com/satellites-reveal-three-decades-of-ecological-ups-and-downs-in-rapidly-urbanizing-nepal/


