


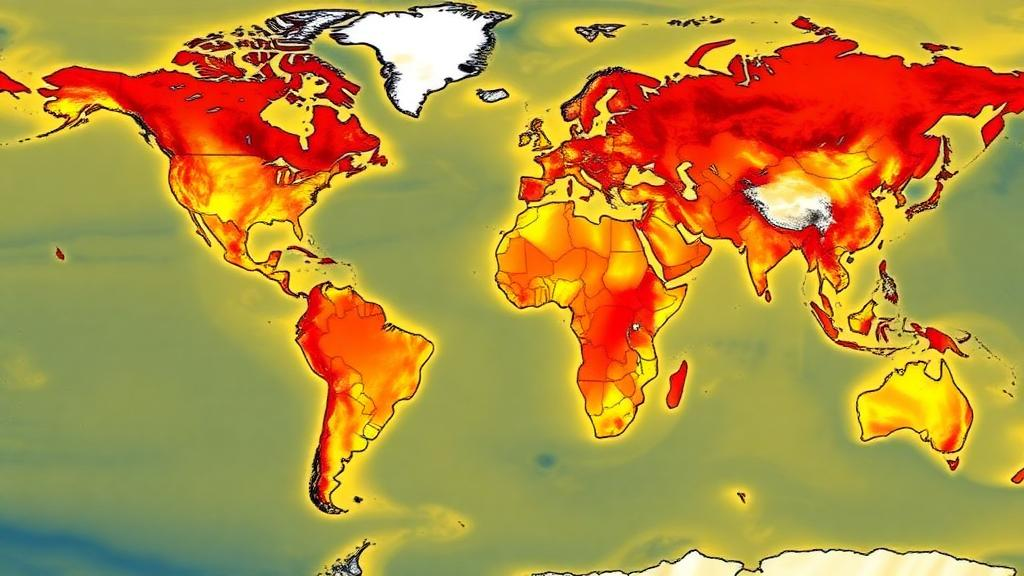
The ocean is getting hotter, and the way scientists count those hot spells has become a scientific problem in its own right. A team led by the Danish Meteorological Institute, working with partners across Europe and India, has now released a global database that tackles the issue head-on. Called MHW-MAD, short for Marine Heat Waves and Cold Spells – Multiple Analysis/Definitions, the dataset covers more than four decades of satellite sea surface temperature observations from 1982 to 2024 and applies ten different definitions of what counts as a marine heatwave, all in parallel. Published in the journal Earth System Science Data, the resource is designed to settle a question that has quietly plagued the field for years: how much of the disagreement between marine heatwave studies is real, and how much is simply an artefact of the definitions researchers choose.
Marine heatwaves are discrete, prolonged periods of abnormally warm water relative to local conditions, and their consequences can be dramatic. The most commonly cited definition, established by Alistair Hobday and colleagues in 2016, identifies a heatwave wherever sea surface temperature exceeds the local 90th percentile for five or more consecutive days. By that measure, events can persist for months and stretch across regions larger than a thousand square kilometres. The ecological stakes are high. An intense heatwave off Western Australia in 2011 stripped roughly 100 kilometres of kelp forest, about 90 percent of the region’s kelp, and triggered a lasting regime shift in the local ecosystem. Coral bleaching, harmful algal blooms, mass mortalities, shifting species distributions and collapsing fisheries have all been linked to these events, and a 2013 to 2016 warm anomaly in the Northeast Pacific, known simply as the Blob, caused widespread seabird and marine mammal deaths.
The evidence that heatwaves are worsening is unambiguous. Between 1925 and 2016, the average annual number of marine heatwave days worldwide increased by more than 50 percent, and many recent events have been attributed to anthropogenic warming. Models project further increases in frequency by the end of the century. Yet the field lacks a single agreed way to detect these events. Some studies anchor their statistics to a fixed historical baseline, such as the World Meteorological Organization’s standard 30-year climate normal of 1991 to 2020, while others use a shifting baseline that moves forward with each year. In a warming ocean, a fixed baseline will flag more recent warm spells as extreme, whereas a moving baseline filters out the long-term trend and highlights year-to-year variability instead. Threshold percentiles, minimum durations and detrending choices add further layers of divergence.
MHW-MAD addresses this fragmentation by computing everything at once. The underlying sea surface temperature record comes from the European Space Agency’s Sea Surface Temperature Climate Change Initiative, version 3.0, which merges infrared and microwave retrievals from 22 different satellite missions into a daily, gap-free global grid at 0.05 degrees resolution, roughly five kilometres. The product is generated with the climate configuration of the OSTIA analysis system, standardises temperatures to a depth of about 20 centimetres, and deliberately avoids assimilating in situ measurements so that satellite-derived trends remain intact. An interim climate data record extends the series from 2022 through 2024 using the same software, ensuring a consistent time series across the full 43-year span.
The methodological machinery behind the database is detailed and reproducible. For every grid cell and every day of the year, the team computed climatological distributions of temperature, including the mean and the 1st, 5th, 10th, 50th, 90th, 95th and 99th percentiles. Two baseline approaches were implemented: a fixed 30-year WMO baseline of 1991 to 2020, and a rolling 30-year window that advances one year at a time from 1982 to 2011 up to 1995 to 2024. Following Hobday’s original two-stage smoothing, percentiles were estimated from an 11-day window centred on each day of the year and then smoothed with a 31-day moving average, which suppresses sampling noise and prevents abrupt day-to-day jumps in the thresholds. A 366-day reference calendar, with 29 February interpolated in non-leap years, keeps anomalies correctly aligned across the record.
Detrending is one of the database’s most consequential features. Because long-term warming raises the baseline temperature, a static climatology will produce ever more frequent heatwave detections in later years, conflating climate change with natural variability. To separate the two, the team performed an ordinary least squares linear regression of temperature against year for each calendar date at each grid cell, pooling all values for that date across 1982 to 2024, and subtracted the fitted trend. The result is a parallel, trend-free version of the record in which detected heatwaves can be interpreted as events driven by variability rather than by the slowly shifting mean. Detrending was applied at every grid cell regardless of statistical significance to keep the database gap-free, though only for the standard Hobday definition.
Beyond the standard 90th-percentile, five-day criterion, the database offers stricter thresholds at the 95th and 99th percentiles and longer persistence requirements of 10 and 30 consecutive days, which isolate only the most durable basin-scale episodes. Each detected event is also assigned a categorical severity index following the Hobday 2018 scheme: category 1 for moderate anomalies just above the threshold, category 2 for strong, category 3 for severe, and category 4 for extreme events where the anomaly exceeds four times the local threshold difference. The same framework is applied symmetrically to the cold tail of the distribution, producing marine cold spell indices based on the 1st, 5th and 10th percentiles, so that warm and cold extremes can be analysed within a single consistent system.
The team tested how these choices matter using a case study of the Blob on 1 January 2014. The event proved robust across all definitions, but its apparent size and intensity shifted considerably. A fixed WMO baseline flagged more area as heatwave, and at higher severity, than warmer later climatologies. Raising the threshold from the 90th to the 95th or 99th percentile progressively screened out moderate anomalies and shrank the affected extent. Globally, requiring 10 consecutive days instead of five reduced heatwave coverage by only about 0.5 percent, while a 30-day minimum cut it by roughly 4 percent. Detrending removed about 1.2 percent of heatwave area worldwide, yet had little effect on the Blob itself, a finding consistent with earlier work attributing that event to natural variability rather than long-term warming. Switching between the WMO and reanalysis baselines changed global coverage by just 0.4 percent, though the Blob appeared more severe under the WMO baseline.
All outputs are delivered as CF-compliant NetCDF files through an ERDDAP server hosted by the Danish Meteorological Institute, with no registration required. Users can download entire files or extract subsets by time, latitude, longitude and variable through a point-and-click web interface, direct URLs, or the rerddap and erddapy packages for R and Python. Three file types are provided: daily climatology files containing the seasonal mean and percentile thresholds, daily anomaly maps for both raw and detrended inputs, and daily category files encoding severity from zero to four. The dataset is also archived on Zenodo with a persistent identifier for citation, and everything is released under a Creative Commons Attribution 4.0 licence.
The practical implications reach well beyond academic bookkeeping. Ecologists can now test whether an impact such as coral bleaching correlates only with the longest, most intense heatwaves, which would argue for management focused on multi-week thermal stress rather than short-lived spikes. Attribution studies can use the detrended anomalies to separate the fingerprint of warming from natural fluctuations. The authors caution that the database covers surface waters only, since subsurface heatwaves may not align with surface events, and that polar regions require targeted products because sea-ice-covered areas carry artificial freezing-point values that would otherwise register as heatwave hot spots. They plan annual updates, additional sea surface temperature products, non-linear detrending and a Python package for users to build their own indicators. By embracing the full spectrum of definitions rather than picking one, MHW-MAD turns a source of confusion into a lens, letting researchers see exactly how much of what we think we know about ocean extremes depends on where we draw the line.
Subject of Research: A multi-definition global database of marine heatwaves and cold spells derived from satellite sea surface temperature data
Article Title: Marine Heat Waves and Cold Spells – Multiple Analysis/Definitions (MHW-MAD): A Multi-Definition Global Marine Heatwave Database from Satellite Sea Surface Temperature Data
Article References: Hayward, A., Dasgupta, N., McAdam, R., Payne, M. R., Raj, R. P., Bonino, G., Chatterjee, S., Combes, V., Denaxa, D., De Rovere, F., Englyst, P., Haapaniemi, V., Hargous, P., Høyer, J., Joseph, K. A., Lopes, B., Oliveira, A., Paixão, J., Silva, F., … Olsen, S. M. (2026). Marine Heat Waves and Cold Spells – Multiple Analysis/Definitions (MHW-MAD): A Multi-Definition Global Marine Heatwave Database from Satellite Sea Surface Temperature Data. Earth System Science Data, 18(10), 7181-7197. https://doi.org/10.5194/essd-18-7181-2026
Image Credits: AI Generated
DOI: 10.5194/essd-18-7181-2026
Keywords: marine heatwaves, sea surface temperature, satellite data, climate change, ocean extremes, marine cold spells, ESA Climate Change Initiative, detrending, climatology, marine ecology, Earth System Science Data, open data
Cite Scienmag News
Violet Maxwell. (October 10, 2026). New Global Database Puts Every Definition of Marine Heatwave on One Map. Scienmag. https://scienmag.com/new-global-database-puts-every-definition-of-marine-heatwave-on-one-map/
Violet Maxwell. "New Global Database Puts Every Definition of Marine Heatwave on One Map." Scienmag, 10 October 2026, https://scienmag.com/new-global-database-puts-every-definition-of-marine-heatwave-on-one-map/. Accessed 10 October 2026.
Violet Maxwell. "New Global Database Puts Every Definition of Marine Heatwave on One Map." Scienmag. October 10, 2026. https://scienmag.com/new-global-database-puts-every-definition-of-marine-heatwave-on-one-map/


