


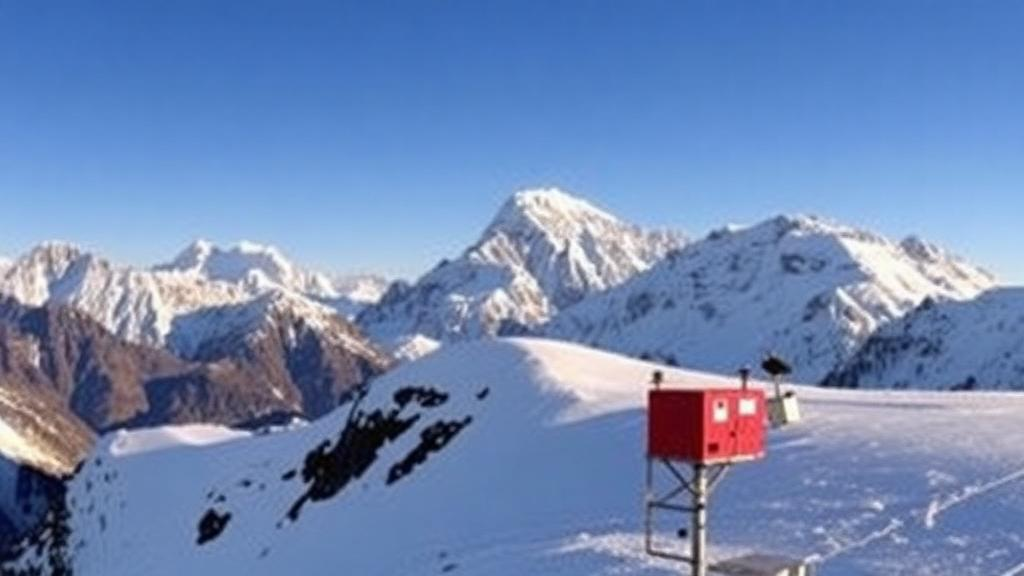
High on the flanks of Mount Everest, where the air holds barely a third of the oxygen found at sea level and winter storms can bury equipment under metres of snow, a network of automatic weather stations has been quietly recording some of the most extraordinary meteorological measurements ever collected. Between 2019 and 2025, a team of National Geographic Explorers, scientists and elite climbing Sherpas installed and maintained six automatic weather stations stretching from the village of Phortse at 3,810 metres to Bishop Rock at 8,810 metres, just below the summit of the world’s highest mountain. The resulting dataset, now published in the journal Earth System Science Data as a quality-controlled, open-access archive, spans nearly five vertical kilometres of elevation and offers scientists an unprecedented window into how temperature, humidity, wind and radiation behave across the full elevational range of Himalayan glaciers.
The effort behind the data was anything but routine. High Mountain Asia contains the largest glacierized area outside the polar regions, yet field research there is notoriously difficult. Low barometric pressure, extreme weather and steep terrain challenge both personnel and instruments, and the region’s stations are frequently disabled by riming, heavy snowfall, battery depletion and communication failures. The Everest stations were installed as part of the National Geographic and Rolex Perpetual Planet Everest Expeditions, with Sherpa climbers bolting custom aluminium tripods designed by Campbell Scientific directly to rock and guying them to additional anchor points. The Balcony station at 8,430 metres was toppled by extreme winds and anchor failure in January 2020, prompting a return expedition in May 2022 that installed the new Bishop Rock station at 8,810 metres and upgraded the South Col site.
Each station carries a carefully engineered suite of sensors. Air temperature and relative humidity are measured with Vaisala HMP155A-L5-PT probes housed in naturally ventilated 14-plate solar radiation shields, while barometric pressure is recorded with Vaisala PTB110 and PTB210 sensors inside the datalogger enclosures. Wind speed and direction initially came from R. M. Young 05108-45 anemometers, but all four units installed at the two highest sites failed in the extreme conditions, and the team replaced them with a polycarbonate version of the sensor plus a custom Richards C5C anemometer and pitot tube made by the Mount Washington Observatory. Radiation components are captured with Hukseflux pyranometers and pyrgeometers, and precipitation is measured at the two lowest stations with OTT Pluvio2 weighing gauges fitted with double-Alter wind shields to reduce the wind-induced undercatch that plagues snowfall measurement in exposed mountain terrain.
The engineering details reveal how altitude dictated design choices. At the lower stations, sensors sit 2 metres above the ground and batteries live inside the datalogger box; at the highest sites, sensors were mounted lower, at about 1.5 metres, to reduce both wind loading and the leverage, or torque, that a taller pole would exert on the tripod base during severe gusts. Batteries at the upper stations were placed in separate insulated boxes to protect them from extreme cold, and both boxes were bolted to rock to cut wind drag. The lower stations weigh roughly 60 kilograms each, the upper ones about 52 kilograms including the experimental pitot tube. Data are logged on Campbell Scientific CR1000X dataloggers at intervals from 10 minutes to daily, and the published archive provides quality-controlled hourly values in Coordinated Universal Time.
Because raw readings from such a hostile environment are riddled with artefacts, the team applied a multistage quality control procedure. Relative humidity values exceeding 100 percent were capped at that physical limit, and artificially low readings caused by the logger computing humidity with respect to water rather than ice at sub-zero temperatures were corrected using Buck’s equations for saturation vapour pressure. Periods of zero wind speed combined with zero directional variability were flagged as sensor freezing and removed rather than mistaken for calm conditions. Night-time incoming shortwave radiation below 7 watts per square metre was set to zero, and an albedo-based correction recalculated compromised radiation values whenever fresh snow or rime on the upward-facing sensor pushed the apparent surface albedo above the realistic threshold of 0.95.
The resulting climatology, though based on a short record, paints a vivid seasonal picture. Mean annual temperatures were 4.1 degrees Celsius at Phortse, minus 3.1 degrees at Base Camp and minus 10.2 degrees at Camp II. At South Col, July was the warmest month with a mean of minus 12.2 degrees and a striking diurnal range of 10.2 degrees, while February averaged minus 29.7 degrees. Precipitation clearly delineates the seasons: winters are predominantly dry, amounts build through the pre-monsoon, and the June-to-September monsoon delivers 72 percent of annual precipitation at Phortse and 77 percent at Base Camp. The mean annual precipitation gradient between the two sites, separated by roughly 1,500 metres, was minus 107 millimetres per kilometre, but it weakens by almost half during the monsoon, indicating that relative precipitation drops with elevation are far steeper outside the monsoon season.
Temperature gradients proved equally revealing. Between Phortse and Base Camp the mean temperature gradient was minus 4.8 degrees Celsius per kilometre, least negative in winter and most negative in the pre-monsoon. When the four stations with minimal data gaps were combined, the gradients became more strongly negative, at minus 6.5 degrees per kilometre in the pre-monsoon, minus 5.7 in the monsoon and minus 6.0 annually. The authors caution that the temperature-altitude relationship in the Khumbu region is fundamentally non-linear, which limits direct comparison with lapse rates calculated across different elevational ranges, and they therefore provide a non-linear equation for the gradient between Phortse and South Col. Radiation measurements add further nuance: maximum daily incoming longwave radiation during the monsoon exceeds 350 watts per square metre at Phortse but stays below about 250 at South Col, likely reflecting the colder, drier, less cloudy atmosphere aloft.
A central contribution of the study is a rigorous comparison with ERA5, the fifth-generation global reanalysis produced by the European Centre for Medium-Range Weather Forecasts that many researchers use as a stand-in for sparse mountain observations. Extracted from the nearest grid point at the 350 hectopascal pressure level, ERA5 temperatures tracked observed variability at South Col reasonably well, with coefficients of determination above 0.6 in both 2019 and 2022, and even higher agreement of 0.85 with the short Balcony record in 2019. But the reanalysis systematically underestimated air temperature, showed far less diurnal variability because the pressure level represents the free atmosphere rather than the surface, and consistently overestimated mean wind speeds, with mean absolute errors of 4.8 and 5.3 metres per second in 2019 and 2022. Relative humidity comparisons carried mean absolute errors above 20 percent, though 10-day running means from both datasets clearly captured the monsoon onset at South Col on 1 July 2019 and 14 June 2022.
The practical implications reach well beyond atmospheric science. Observations from South Col reveal mean winds that can exceed 30 metres per second and gusts above 60 metres per second, conditions capable of blowing mountaineers off their feet and inducing cold injuries. Pressure data from the network have already shown that oxygen availability at the summit varies on synoptic timescales, meaning the apparent elevation of Everest, how high the mountain would feel without supplemental oxygen, can shift by almost 750 metres, and a winter ascent without bottled oxygen may at times be impossible. The team anticipates that ERA5, once its time-varying biases are corrected with empirical-statistical or machine-learning approaches, could be used to gap-fill and extend the intermittent records from Everest’s upper slopes, enabling hyper-local forecasts that help expeditions identify optimal climbing windows.
The archive also underpins research on the region’s fragile cryosphere and its role as a freshwater source for downstream communities. It has already been used to estimate surface energy balances at the summit and at South Col Glacier, revealing a high-altitude ice system acutely sensitive to changes in effective precipitation because of extremely high insolation and its responsiveness to albedo variations. Combined with the longer-running EvK2CNR and GLACIOCLIM networks at lower elevations, the new data allow quantification of elevational gradients in key meteorological variables across roughly five vertical kilometres, covering the entire glacierized range of the Khumbu region, information essential for distributed glacier and hydrological modelling. And because meteorological measurements from the highest reaches only began in 2022, the authors note that scientists are still at the very beginnings of exploring the weather of this extreme environment, with questions the data might answer likely to grow rapidly across disciplines far beyond the climate sciences.
Subject of Research: High-altitude weather station observations across the Mount Everest region of Nepal
Article Title: Weather station data from the Mount Everest region, Nepal: 3810–8810 m above sea level
Article References: Khadka, A., Perry, L. B., Matthews, T., Sherpa, T. G., Shrestha, C. B., Shrestha, D., Aryal, D., Tuladhar, S., Pradhananga, N., Kayastha, D., Raichle, B., Athans, P., Sherpa, D. Y., Garrett, K., Wheeler, G., Young, T., & Elmore, A. (2026). Weather station data from the Mount Everest region, Nepal: 3810–8810 m above sea level. Earth System Science Data, 18(10), 7253-7267. https://doi.org/10.5194/essd-18-7253-2026
Image Credits: AI Generated
DOI: 10.5194/essd-18-7253-2026
Keywords: Mount Everest, automatic weather stations, Himalaya, climate data, ERA5 reanalysis, temperature lapse rate, monsoon, glaciology, high-altitude meteorology, Khumbu, quality control, open data
Cite Scienmag News
Violet Maxwell. (October 10, 2026). World’s Highest Weather Stations Reveal Everest’s Extreme Climate From Valley to Summit. Scienmag. https://scienmag.com/worlds-highest-weather-stations-reveal-everests-extreme-climate-from-valley-to-summit/
Violet Maxwell. "World’s Highest Weather Stations Reveal Everest’s Extreme Climate From Valley to Summit." Scienmag, 10 October 2026, https://scienmag.com/worlds-highest-weather-stations-reveal-everests-extreme-climate-from-valley-to-summit/. Accessed 10 October 2026.
Violet Maxwell. "World’s Highest Weather Stations Reveal Everest’s Extreme Climate From Valley to Summit." Scienmag. October 10, 2026. https://scienmag.com/worlds-highest-weather-stations-reveal-everests-extreme-climate-from-valley-to-summit/


