


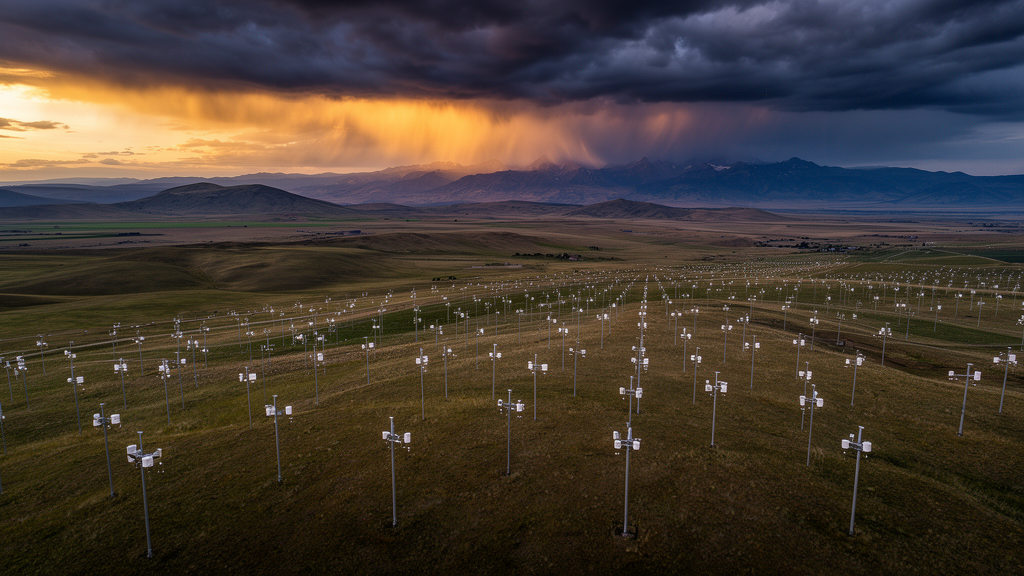
Scientists at Environment and Climate Change Canada have unveiled a dramatically upgraded precipitation record that reconstructs rain and snowfall across North America for every day from 1980 to 2024. The new dataset, part of version 3.2 of the Canadian Surface Reanalysis (CaSR), is described in a peer-reviewed study published in Hydrology and Earth System Sciences. Unlike most reanalysis products, which lean heavily on numerical weather prediction models, the new precipitation component directly assimilates tens of thousands of ground-based weather station observations, producing estimates that are more reliable than both its predecessor and widely used global alternatives, particularly in regions where measurements are scarce.
The product at the heart of the release is known as CaPA-24h, an offline daily precipitation reanalysis built on the Canadian Precipitation Analysis system. It works by combining a background precipitation field generated by the reanalysis’s dynamical component with a dense network of daily surface observations through an optimal interpolation algorithm. The background field comes from a regional numerical weather prediction model coupled with a land-surface data assimilation system, while the analysis step nudges that model output toward reality wherever gauges have actually measured what fell from the sky. The result is a gridded, physically consistent precipitation record at roughly 10-kilometre resolution that spans the entire North American domain for 45 years.
Version 3.2 brings substantial technical modernization. The underlying atmospheric model, the Global Environmental Multiscale system, now runs with updated physical parameterizations, higher vertical resolution, and sharper topographic representation, and it is initialized with atmospheric conditions from the ERA5 global reanalysis rather than the older ERA-Interim. The team also fully reprocessed the Integrated Surface Database used for observations before the year 2000, incorporating trace precipitation information and more accurate station locations. These changes matter most in data-sparse regions, where the background field dominates the final analysis; there, the new version delivers systematically less biased precipitation than version 2.1.
The number of assimilated stations tells a striking story. Before 2000, the analysis ingested roughly 2,000 stations per day on average; afterward, with observations drawn from operational archives and the newly included adjusted Canadian hourly dataset, that figure jumped to about 9,000. All observations pass through automated quality control, including spatial consistency checks that compare each station against its neighbours, seasonal filters for wintertime wind effects on solid precipitation, and additional diagnostics that caught stations reporting implausibly low totals or suspicious extreme events that escaped the standard screening. Bias-corrected Canadian datasets are exempted from some filters but still undergo spatial consistency checks, and duplicate records are removed when adjusted and standard stations sit nearly on top of each other.
To evaluate the product honestly, the researchers used a leave-one-out framework: whenever a station was used to verify the analysis, it was excluded from the assimilation, so the verification reflects genuine predictive skill rather than circular self-agreement. Verification relied on the Frequency Bias Index, which measures whether events are over- or under-forecast; the Equitable Threat Score, which measures detection skill after accounting for chance; and the partial mean, which isolates conditional precipitation intensity. At station locations, the new and old versions perform comparably, which the authors attribute to the strong constraint imposed by the gauges themselves. The real gains appear in the background fields, which show reduced frequency bias and improved intensity characteristics across most regions and seasons.
Comparisons with independent gridded datasets sharpen the picture. Against ERA5-Land, the land component of a leading European global reanalysis, CaPA-24h version 3.2 provides more accurate seasonal and regional precipitation patterns. ERA5-Land tends to overestimate the frequency of light to moderate precipitation while underestimating high-intensity events, and it produces smoother fields that miss fine-scale spatial variability. Against PRISM, a high-resolution observation-based dataset for the contiguous United States, the Canadian product shows closer agreement over much of the eastern domain, reproducing sharper gradients and regional contrasts. A frequency-intensity decomposition revealed that biases in seasonal totals are usually driven by errors in wet-day frequency rather than intensity, and it exposed cases where ERA5-Land’s compensating frequency and intensity errors mask real deficiencies behind seemingly accurate totals.
Extreme precipitation tells a more nuanced story. Using the Kling-Gupta Efficiency score to evaluate indices such as the annual maximum one-day precipitation and the contribution of very wet days to annual totals, the study finds a pronounced east-west contrast. East of the major mountain ranges, the new reanalysis generally outperforms ERA5-Land in all seasons, with scores between 0.7 and 0.9 driven by near-perfect bias and correlation. In the western cordillera, however, performance degrades for both products, with orographic precipitation remaining a stubborn challenge. Both reanalyses also systematically underestimate summer accumulations over large portions of the United States relative to PRISM, a signal the authors attribute to the difficulty of capturing sub-grid convective storms rather than to observational coverage.
The team also assessed, for the first time, the hourly precipitation product derived by temporally disaggregating the daily analysis. The disaggregation preserves realistic timing from the model forecasts while enforcing consistency with the daily totals, and it successfully reproduces the expected late-afternoon peak of warm-season convective precipitation across many regions. But artificial peaks appear at fixed synoptic hours, reaching about 0.02 millimetres per hour in summer, reflecting the stitching together of forecast segments of different lead times and the model’s spin-up behaviour. These artefacts can distort event-duration statistics and derived hydrological indicators, and the authors flag more advanced, potentially machine-learning-based disaggregation methods as a priority for future versions.
For users who need data beyond December 2024, the study examines whether the operational version of the Canadian Precipitation Analysis can seamlessly extend the record. Comparing the two systems over the 2021-2022 water year showed broad consistency at climatological scales, with overlapping seasonal time series and coherent interannual variability. The operational system assimilates radar and satellite precipitation estimates during liquid-precipitation events, which improves spatial coherence but introduces localized differences, most notably in summer over eastern Canada. The authors conclude that appending the operational product is appropriate for trend assessments and seasonal-to-interannual studies, but caution is warranted for weather-scale or event-based analyses, particularly during convective regimes.
The dataset arrives at a moment when accurate precipitation records underpin everything from flood forecasting and drought monitoring to water resource management and the training of artificial intelligence weather models. Its limitations are candidly documented: biases persist in southern and western mountainous areas, the pre-2000 period is more sensitive to sparse station density, and the observing-system transition around 2000 warrants caution in long-term trend analyses. Even so, with roughly 40 surface variables distributed alongside the precipitation fields, a confidence index telling users how strongly each grid cell is constrained by observations, and public availability through the Environment and Climate Change Canada data portal, the new release offers hydrologists, climatologists, and impact researchers one of the most observationally grounded pictures yet of how water has fallen across North America over the past four and a half decades.
Subject of Research: A 45-year high-resolution precipitation reanalysis for North America combining weather model forecasts with ground-station observations
Article Title: The Canadian Surface Reanalysis (CaSR) v3.2 precipitation dataset: a 45-year high-resolution analysis for North America (1980–2024)
Article References: Khedhaouiria, D., Gasset, N., Fortin, V., Dimitrijevic, M., Bulat, M., & Wang, X. (2026). The Canadian Surface Reanalysis (CaSR) v3.2 precipitation dataset: a 45-year high-resolution analysis for North America (1980–2024). Hydrology and Earth System Sciences, 30(18), 5971-5998. https://doi.org/10.5194/hess-30-5971-2026
Image Credits: AI Generated
DOI: 10.5194/hess-30-5971-2026
Keywords: precipitation reanalysis, CaSR, CaPA, North America, data assimilation, hydrology, climate dataset, ERA5-Land, PRISM, extreme precipitation, Environment and Climate Change Canada, water resources
Cite Scienmag News
Violet Maxwell. (October 9, 2026). New 45-Year Precipitation Map of North America Blends Weather Models with Thousands of Rain Gauges. Scienmag. https://scienmag.com/new-45-year-precipitation-map-of-north-america-blends-weather-models-with-thousands-of-rain-gauges/
Violet Maxwell. "New 45-Year Precipitation Map of North America Blends Weather Models with Thousands of Rain Gauges." Scienmag, 9 October 2026, https://scienmag.com/new-45-year-precipitation-map-of-north-america-blends-weather-models-with-thousands-of-rain-gauges/. Accessed 9 October 2026.
Violet Maxwell. "New 45-Year Precipitation Map of North America Blends Weather Models with Thousands of Rain Gauges." Scienmag. October 9, 2026. https://scienmag.com/new-45-year-precipitation-map-of-north-america-blends-weather-models-with-thousands-of-rain-gauges/


