


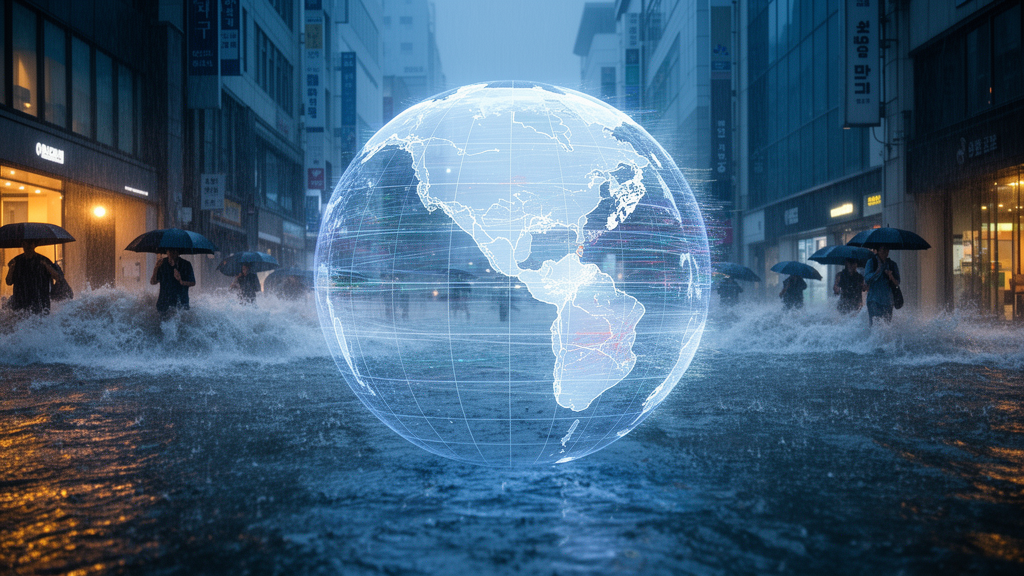
Artificial intelligence has stormed into weather forecasting with a speed and accuracy that has stunned meteorologists, but a new study from South Korea delivers a sobering reality check. Researchers at Seoul National University and Pusan National University have put Google’s GraphCast, one of the most celebrated AI weather prediction models, through a rigorous test against some of the most dangerous rainfall events in South Korea’s recent history. Their verdict, published in Theoretical and Applied Climatology, is a study in contrasts: the AI model paints the broad strokes of a storm beautifully, yet it falters precisely where forecasts matter most for saving lives, at the sharp peaks of extreme precipitation.
The stakes of this evaluation could hardly be higher. In the summer of 2020, record-breaking heavy precipitation swept across South Korea, claiming 46 lives and leaving people missing, while inflicting property damage of roughly 860 million dollars. The memory of that disaster, alongside the catastrophic July 2021 rainfall in China’s Henan Province that killed 398 people and caused about 19 billion dollars in direct economic losses, frames the urgency of the research. With climate change expected to increase the frequency of extreme precipitation events, the question of whether AI models can be trusted to warn of such hazards has become one of the most consequential in modern meteorology.
GraphCast represents a fundamentally different approach to forecasting than the numerical weather prediction models that have dominated the field for decades. Rather than solving the physical governing equations of the atmosphere, GraphCast uses graph neural networks arranged in an encoder-processor-decoder configuration to learn how atmospheric states evolve, drawing on more than four decades of historical reanalysis data from 1979 to 2017. Trained on the European Centre for Medium-Range Weather Forecasts’ ERA5 dataset, the model autoregressively predicts meteorological variables, including precipitation, at six-hour intervals with a horizontal resolution of about 25 kilometers. Its computational speed is extraordinary, producing forecasts in minutes on a single processor where traditional models require supercomputers running for hours.
To assess whether that speed comes at the cost of accuracy, the research team selected the ten days in the summer of 2020 with the largest accumulated precipitation over South Korea, spanning late June through mid-August. These cases featured daily maximum precipitation exceeding 130 millimeters and countrywide averages ranging from roughly 30 to 70 millimeters. Crucially, the team evaluated the model against observations from 549 rain gauges operated by the Korea Meteorological Administration, a ground-truth network widely regarded as the most reliable source of precipitation data. This choice matters, because most previous evaluations of AI weather models relied on reanalysis or analysis products, which can themselves carry biases that flatter models trained on similar data.
For comparison, the researchers ran the Weather Research and Forecasting model, a physics-based numerical system, at three horizontal resolutions of 27, 9, and 3 kilometers. For each heavy precipitation day, they performed 27 WRF simulations using different combinations of microphysics, boundary-layer, and radiation schemes, averaging the results to account for the model’s sensitivity to parameterization choices. Both the AI and numerical models were initialized with the same ERA5 data, creating as fair a head-to-head comparison as the profound architectural differences between the two systems allow.
The results on broad precipitation patterns were genuinely impressive for GraphCast. Using metrics that measure overall spatial structure, including normalized mean bias, normalized centered root-mean-square error, and spatial correlation coefficient, the AI model matched or beat the numerical simulations. Its normalized mean bias of about negative 14 percent was comparable to the 27-kilometer WRF’s roughly negative 13 percent, and its centered error was the smallest of all the models tested. Its spatial correlation of about 0.54 exceeded the 0.46 of the similarly resolved WRF, though the 3-kilometer WRF reached higher at about 0.62. GraphCast also proved remarkably adept at capturing the synoptic setup of the storms, reproducing the strong low-pressure systems, the monsoon-frontal pressure gradients, and the atmospheric-river-like moisture transports exceeding 1250 kilograms per meter per second that funnel water vapor toward the Korean Peninsula.
But the picture darkened when the team examined precipitation by intensity. Using the equitable threat score, neighborhood versions of that score, and contingency-table metrics across thresholds from 5 to 100 millimeters, GraphCast showed a systematic distortion of the rainfall distribution. It overpredicted light precipitation at or below 20 millimeters, painting wider areas of appreciable rain than actually occurred, while severely underpredicting heavy precipitation at or above 70 millimeters. Averaged across the 70 to 100 millimeter thresholds, its frequency bias was a mere 0.22, compared with 0.61 for the 27-kilometer WRF, and its probability of detection was just 0.16. In eight of the ten cases, GraphCast missed the observed precipitation peaks above 100 millimeters entirely, producing smoothed fields that washed out the most dangerous local maxima.
A clever resolution-matching experiment revealed that this weakness was not simply an artifact of the model’s 25-kilometer grid. When the higher-resolution WRF outputs were degraded to 27 kilometers, their advantage at heavy thresholds persisted, indicating that GraphCast’s deficit lies in its ability to represent precipitation peaks with spatial scales of roughly 25 to 100 kilometers, features that are resolvable even at coarse resolution. The researchers trace this limitation to two likely culprits. First, the ERA5 training data themselves struggle to capture heavy precipitation, meaning the model may have learned a systematically muted version of extreme rainfall. Second, the use of mean squared error as the training objective tends to blur small-scale variability through the well-known double penalty effect, in which a correctly predicted feature that is slightly misplaced is penalized twice, once as a false alarm and once as a miss.
Perhaps the most novel contribution of the study is its examination of physical consistency, an aspect of AI weather models that had not previously been tested for precipitation. The team focused on the Sobaek Mountains, where topographic lifting enhances rainfall during warm-season events. Observations showed the terrain-adjacent region received 20 millimeters more precipitation than nearby lowland areas on average. GraphCast reproduced only 42 percent of that enhancement, or an 8-millimeter difference, while the WRF models captured 63 to 90 percent. Strikingly, although both GraphCast and the 27-kilometer WRF simulated nearly identical synoptic conditions and moisture transport intensities, the upward motions over the mountains were considerably weaker in GraphCast, failing to exceed the 0.5 pascals per second seen in the numerical model, despite nearly identical mountain heights in both simulations. This suggests the AI model, unconstrained by physical equations, fails to fully translate moisture-laden flow over terrain into the orographic lifting that drives enhanced precipitation.
The authors are careful to frame these findings not as a verdict on AI versus physics in general, but as a measurement of where the current generation of AI models stands. Their results echo earlier reports that machine learning models struggle with mesoscale variability in temperature, wind, and intense precipitation, and they point toward promising remedies: better objective functions than mean squared error, high-resolution open-access training datasets from convection-permitting models, and hybrid strategies that pair AI models for locating precipitation features with numerical models for quantifying their intensity. Given GraphCast’s enormous computational advantages and its demonstrated skill with large-scale patterns, the study suggests the future of high-impact weather forecasting may lie not in choosing between silicon and physics, but in designing systems that combine the strengths of both, ensuring that the deadliest details of a storm are no longer smoothed away.
Subject of Research: Skill assessment of the AI-based weather prediction model GraphCast in forecasting heavy precipitation over South Korea
Article Title: Skill assessment of AI-based weather model in heavy precipitation prediction over South Korea
Article References: Hong, S.-H., Park, K., Kim, D.-H., Baik, J.-J., & Jin, H.-G. (2026). Skill assessment of AI-based weather model in heavy precipitation prediction over South Korea. Theoretical and Applied Climatology, 157(9), Article 606. https://doi.org/10.1007/s00704-026-06536-w
Image Credits: AI Generated
DOI: 10.1007/s00704-026-06536-w
Keywords: GraphCast, AI weather prediction, heavy precipitation, South Korea, WRF model, forecast verification, topographic precipitation, extreme weather, machine learning, ERA5, equitable threat score, physical consistency
Cite Scienmag News
Violet Maxwell. (October 9, 2026). AI Weather Model Excels at Big Picture but Misses South Korea’s Deadliest Downpours. Scienmag. https://scienmag.com/ai-weather-model-excels-at-big-picture-but-misses-south-koreas-deadliest-downpours/
Violet Maxwell. "AI Weather Model Excels at Big Picture but Misses South Korea’s Deadliest Downpours." Scienmag, 9 October 2026, https://scienmag.com/ai-weather-model-excels-at-big-picture-but-misses-south-koreas-deadliest-downpours/. Accessed 9 October 2026.
Violet Maxwell. "AI Weather Model Excels at Big Picture but Misses South Korea’s Deadliest Downpours." Scienmag. October 9, 2026. https://scienmag.com/ai-weather-model-excels-at-big-picture-but-misses-south-koreas-deadliest-downpours/


