


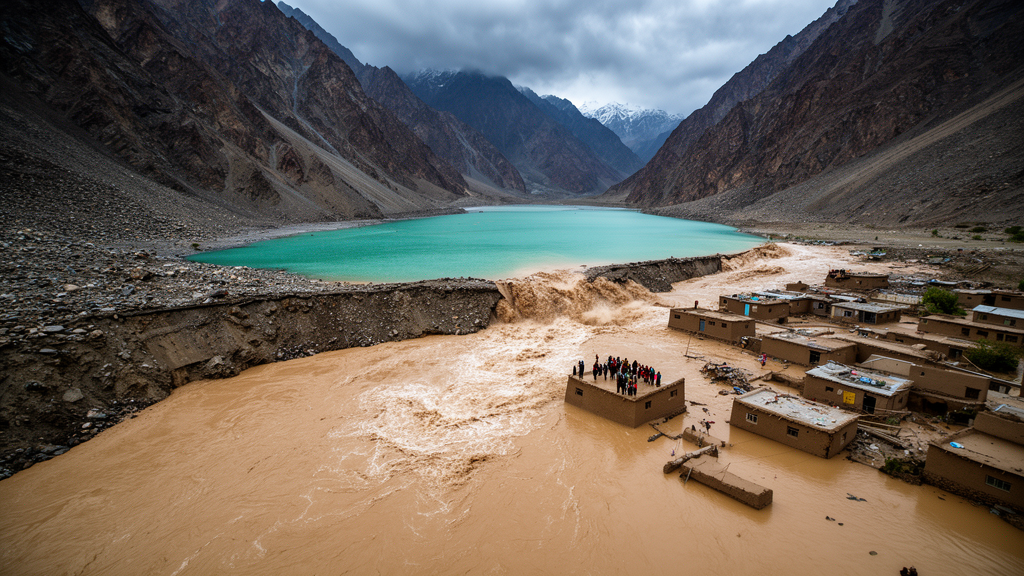
In the steep valleys of Afghanistan’s Panjshir province, a glacial lake can appear from nothing and destroy a village within six weeks. That is the stark conclusion of a new open-access study published in the journal Natural Hazards, which reconstructs two devastating glacial lake outburst floods, or GLOFs, that struck the Peshghor valley in 2018 and 2021. Led by Fayezurahman Azizi of the University of Lausanne, the research provides the first quantitative modeling of GLOF propagation in Afghanistan and exposes a blind spot in the way scientists typically hunt for dangerous lakes: the most lethal ones may be the youngest.
The team combined field observations, satellite imagery, and two-dimensional hydrodynamic simulation to reconstruct the 12 July 2018 outburst from the Kunj-Peshghor lake, which killed four people, destroyed more than forty houses, and swept away irrigation canals and infrastructure in Peshghor village. The flood struck at midnight. Shepherds on the mountainside, seeing the surge coming, fired gunshots to warn villagers downstream, but many residents were asleep and never received the message. The flood wave from the Peshghor tributary carried so much sediment into the main Panjshir river that it temporarily dammed the larger channel, creating a lake that backed up 1.7 kilometers upstream from the confluence.
What makes the 2018 event scientifically remarkable is how quickly the lake itself formed. Satellite records show the Kunj-Peshghor lake appeared around 2 June 2018 on the surface of a debris-covered glacier and expanded rapidly over just 42 days before draining catastrophically. The 2021 Bam-Tanab event followed an almost identical script: a supraglacial pond formed and grew over roughly 33 days before breaching on 4 July, damaging twelve houses, eight irrigation canals, four micro-hydropower plants, and a rural water supply network. Both lakes belong to a class the authors call debris-ice glacial lakes, unstable water bodies dammed by mixtures of ice and rock debris that can vanish overnight.
The triggers were intensely local. In 2018, sustained high air temperatures, very low humidity, and an absence of rainfall drove rapid snow and ice melt that filled the lake, before water eroded a subglacial tunnel beneath the glacier and drained it from below. In 2021, extreme heat combined with a significant rainfall event five days before the outburst, which swelled inflows into both the pond and the main lake until an englacial tunnel roughly five by seven meters widened on the lake’s north side and released about 25,000 cubic meters of the stored 33,400 cubic meters. Field reports noted the collapse of around five meters of surrounding ice as the conduit enlarged.
To quantify what such a flood does on its way downhill, the researchers coupled the BASEbreach dam-breach module with the open-source BASEMENT two-dimensional hydrodynamic model, solving the shallow water equations on an unstructured triangular mesh built from a 10-meter digital elevation model, resampled to 14 meters for computation. Building footprints digitized from pre-event Planet imagery were raised by five meters in the terrain model so the mesh represented houses as flow obstacles. The model domain was divided into seven land-cover classes, from riverbed and floodplain to roads, crops, and trees, each assigned its own Strickler friction coefficient ranging from 10 for trees to 60 for roads.
Calibration against the flood extent mapped from 3-meter Planet imagery one day after the disaster identified an optimal roughness combination with a precision of 0.95 and an F1-score of 0.990. Because no gauging stations exist along the valley, validation relied on flood marks left on mosque walls, containers, and a car, which indicated depths of 1.6 to 2.0 meters in the worst-hit areas; simulated depths differed from these observations by only about 0.2 meters on average. The empirical breach analysis yielded a peak discharge of roughly 507 cubic meters per second, delivered as an asymmetric hydrograph rising to its peak within about 2,000 seconds and receding over nearly three hours, with a total released volume of about 880,000 cubic meters.
The simulations reveal a flood that is anything but uniform. Near the source, depths were modest at around two meters, but as the flow funneled through constricted valley sections, velocities peaked at 7.5 meters per second at roughly 6.5 and 11 kilometers downstream, and depths exceeded 10 meters in the mid-reach between 8.5 and 9 kilometers. In the lower valley near Peshghor village, velocities of about six meters per second persisted with depths of 2.5 to 6 meters. Sensitivity tests showed that doubling or halving channel friction shifted peak depths between 9.2 and 13.1 meters and peak velocities between 8.6 and 9.5 meters per second, while total inundated area changed by only about six percent, suggesting flood extent alone is a poor calibration target and that depth and velocity distributions matter more.
Downstream hydrological records add a second, often overlooked act to the disaster. At the Tangi-Gulbahar monitoring station, turbidity spiked above 800 NTU immediately after the 2018 outburst and declined only over several days, while daily discharge jumped from 75 to over 160 cubic meters per second in 2018 and above 170 in 2021. Both stations recorded two distinct water-level peaks: the first from the original flood surge, the second when debris temporarily blocked the Panjshir river and then released. The river channel itself widened from 30 to 50 meters before the flood to nearly 250 meters in places, with more than 200 meters of channel choked by flood debris. These secondary surges prolong flooding, degrade water quality, and complicate emergency response in ways that single-peak hazard models miss.
Overlaying simulated inundation on land-use data showed that roughly 46 percent of the flooded area in Peshghor village falls within high to very high hazard zones, including homes, the main mosque and madrasa, the district road, market areas, and agricultural land. Very high hazard zones cover about 18 percent of the inundation, concentrated along the main channel, with high hazard zones adding another 28 percent. The simulated extent closely matched the documented 2018 damage: about 80 houses affected, 40 destroyed, roughly 20 hectares of cultivated land lost, 400 meters of irrigation canal, two bridges, 1.5 kilometers of road, and one micro-hydropower facility. Villagers rebuilt in the same flood zone after 2018, only to be hit again in 2021, a pattern that underscores how exposure persists when hazard maps do not exist.
The broader implication is uncomfortable for the field. Conventional GLOF hazard assessments rely on remote-sensing inventories of long-lived, moraine- or bedrock-dammed lakes, rating their susceptibility from dam characteristics and surrounding conditions. But lakes that form and fail within weeks, draining through hidden englacial tunnels that are nearly invisible from orbit before collapse, escape such screening entirely. Between 1990 and 2020 the number of glacial lakes in Afghanistan’s Hindu Kush rose 32 percent to around 2,600, with 17 percent newly formed, and recent assessments flag more than 36 lakes as highly susceptible. With roughly one million people across High Mountain Asia living within 10 kilometers downstream of dangerous lakes, the authors argue for high-frequency monitoring of debris-covered glaciers, automated lake-level loggers, seismic and acoustic sensors near breach zones, telemetry-linked warning systems that could extend traditional gunshot alerts, and hazard zoning that keeps new construction off the terraces the next flood will claim.
Subject of Research: Glacial lake outburst flood hazard, dam-breach dynamics, and downstream impacts in the Hindu Kush of Afghanistan
Article Title: Glacial lake outburst flood hazard and downstream impacts: lessons from Afghanistan examples
Article References: Azizi, F., Fatihi, A., Antoniazza, G., Bertolazzi, M., Ahmed, R., & Lane, S. N. (2026). Glacial lake outburst flood hazard and downstream impacts: lessons from Afghanistan examples. Natural Hazards, 122(21), Article 665. https://doi.org/10.1007/s11069-026-08449-3
Image Credits: AI Generated
DOI: 10.1007/s11069-026-08449-3
Keywords: glacial lake outburst flood, GLOF, Afghanistan, Hindu Kush, Panjshir, hydrodynamic modeling, BASEMENT, dam breach, debris-covered glacier, climate change, early warning systems, flood hazard mapping
Cite Scienmag News
Violet Maxwell. (October 9, 2026). Deadly Afghan Floods Reveal Glacial Lakes Can Turn Catastrophic in Just Weeks. Scienmag. https://scienmag.com/deadly-afghan-floods-reveal-glacial-lakes-can-turn-catastrophic-in-just-weeks/
Violet Maxwell. "Deadly Afghan Floods Reveal Glacial Lakes Can Turn Catastrophic in Just Weeks." Scienmag, 9 October 2026, https://scienmag.com/deadly-afghan-floods-reveal-glacial-lakes-can-turn-catastrophic-in-just-weeks/. Accessed 9 October 2026.
Violet Maxwell. "Deadly Afghan Floods Reveal Glacial Lakes Can Turn Catastrophic in Just Weeks." Scienmag. October 9, 2026. https://scienmag.com/deadly-afghan-floods-reveal-glacial-lakes-can-turn-catastrophic-in-just-weeks/


