


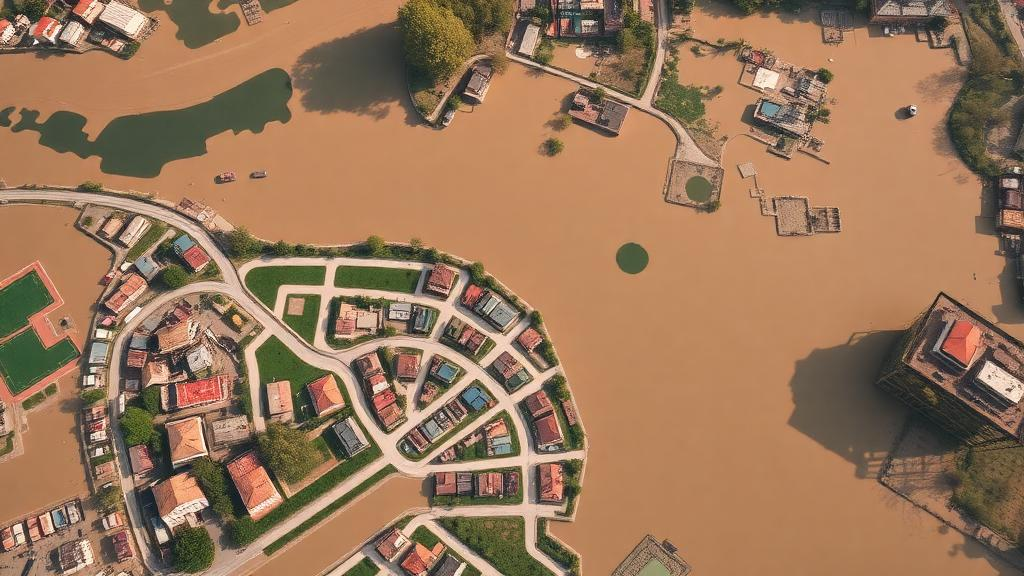
A small city in the eastern Indian state of Bihar has become an unlikely window into one of the defining environmental struggles of our era: the quiet, pixel-by-pixel disappearance of urban wetlands and green cover beneath spreading concrete. Ara, the administrative headquarters of Bhojpur district, sits wedged between the Ganga and Son rivers, a landscape whose very name is believed to derive from a word meaning forest or vegetated area. New research published in Discover Geoscience has now tracked three decades of change in this historically green city, and the picture that emerges from the satellite record is both a warning and, in places, a surprise.
Researchers Latifur Rahaman and Sadaf of the Department of Geography at Veer Kunwar Singh University in Ara analyzed Landsat satellite imagery spanning 1995 to 2025, drawing on data from three generations of sensors: Landsat 5’s Thematic Mapper for the earliest period and the Operational Land Imager instruments aboard Landsat 8 and Landsat 9 for the most recent. Rather than relying on a single measure, the team computed eight complementary spectral indices, each designed to highlight a different feature of the land surface. The Normalized Difference Vegetation Index, or NDVI, exploits the fact that healthy plants absorb red light while reflecting near-infrared radiation, making it the world’s standard yardstick of vegetation vigor. Water detection relied on the Normalized Difference Water Index and its modified cousin, the MNDWI, which swaps the near-infrared band for shortwave infrared to better separate genuine open water from the confusing reflectance of rooftops and roads.
The built-up side of the ledger was quantified with the Normalized Difference Built-up Index, the Urban Index, the Normalized Difference Bareness Index, the Bareness Index, and the Enhanced Built-up and Bareness Index, known as EBBI. Each of these mathematical combinations of red, near-infrared, shortwave-infrared, and thermal bands responds differently to impervious surfaces and exposed soil, and using them together allowed the researchers to cross-check their findings in a way that single-index studies cannot. All imagery was restricted to scenes with less than ten percent cloud cover, downloaded as Level-2 surface reflectance products, and processed in ArcGIS 10.8. Crucially, the team captured both pre-monsoon scenes in April and May, when the landscape is dry and vegetation sparse, and post-monsoon scenes in October and November, when the southwest monsoon has recharged wetlands and pushed vegetation to its annual peak.
The statistical backbone of the analysis came from more than 20,000 pixels per image, each about 30 meters across. Mean values, standard deviations, and coefficients of variation were extracted for every index in every season, and Pearson’s correlation analysis was then run on the mean values at the 95 percent confidence level. This dual approach, combining visual mapping with quantitative comparison, is what gives the study its unusual depth for a medium-sized city in eastern India, a category of rapidly urbanizing settlement that the authors argue has been chronically underserved by large-scale remote sensing research focused on megacities.
The vegetation results tell a story of seasonal divergence. In the pre-monsoon season, mean NDVI actually rose slightly, from about 0.130 in 1995 to 0.164 in 2025, and the minimum and maximum values in 2025 suggested healthier vegetation in the dry season than three decades earlier, a pattern the authors read as evidence that human efforts to nurture greenery have made some progress. But the post-monsoon picture reversed sharply. Mean NDVI fell from roughly 0.296 in 1995 to 0.212 in 2025, and the standard deviation nearly doubled, from 0.050 to 0.081, signaling that once-contiguous green patches have become fragmented and uneven. In 1995, the post-monsoon city was predominantly green; by 2025, the reddish-yellow tones of degraded vegetation had spread from the center toward the western parts of the study area.
The water indices revealed an even more nuanced transformation. The MNDWI, which is specifically tuned to distinguish open water from built-up backgrounds, showed a reduction in genuine water features, consistent with landfilling of low-lying land for construction. Yet the standard NDWI showed higher values in 2025, pointing to an increase in water-associated surfaces within the urban fabric. The explanation lies in the geometry of the changes: natural, irregularly shaped wetlands visible in the 1995 imagery had given way to round and square water bodies in 2025, the unmistakable signatures of human excavation. Soil extracted for raising roads and dwelling plinths leaves behind pits that fill with water, much of it sustained by sewage inflow. The area of water-associated surfaces has, in a sense, expanded, but the health of that water has deteriorated, with key index values declining substantially between 1995 and 2025 in both seasons.
The built-up indices left little room for doubt about the driving force. The Urban Index recorded the largest change of any measure, climbing from minus 0.042 to 0.095 in the pre-monsoon period and from minus 0.282 to 0.087 after the monsoon, a clear spectral fingerprint of expanding construction. Built-up growth radiated outward from the urban core, with barren land concentrated around new development at the city’s outskirts. The correlation analysis then tied the threads together: NDVI was negatively and significantly correlated with all the built-up indices, and MNDWI was negatively and significantly correlated with every built-up measure, quantifying the inverse relationship between urbanization and the two pillars of urban ecological health. Only NDWI broke the pattern, correlating positively with built-up indices, echoing the finding that construction and man-made water surfaces have grown together.
The ecological stakes extend beyond aesthetics. Wetlands are often described as the kidneys of the landscape, buffering floods, purifying water, storing carbon dioxide, and recharging groundwater, while urban vegetation moderates the heat island effect and shelters biodiversity. India’s Ministry of Environment, Forest and Climate Change lists wetlands among the most valuable habitats for migratory birds, and the authors point to regional evidence that wetland and tidal flat degradation across South and Southeast Asia has contributed to migratory bird declines. Ara’s wetlands, including the Garha wetland behind the new campus of Veer Kunwar Singh University, now sit in close proximity to active urban development, and field photographs accompanying the study document landfill and construction pressing against these habitats. The authors are careful to note that no direct biodiversity surveys were conducted, so any impact on birds remains a hypothesis awaiting field verification rather than a demonstrated outcome.
The study’s limitations are candidly acknowledged. Landsat’s 30-meter resolution blurs small wetlands and narrow vegetation corridors into mixed pixels, the analysis rests entirely on remotely sensed data without ground-truthing of water quality or depth, and image availability constrained the seasonal windows to two-month ranges rather than identical calendar dates. The correlation sample, built from four seasonal means, is small, and some relationships, such as the strong negative NDWI-NDVI correlation, did not reach statistical significance. The authors frame their findings as statistical associations rather than proven cause and effect, and they call for future work combining high-resolution imagery, hydrological measurements, and biodiversity field surveys, potentially augmented with machine learning and socioeconomic data.
What makes the study resonate is its method as much as its message. By fusing eight indices across two seasons and thirty years, it offers a template for monitoring the hundreds of mid-sized cities across the developing world that are urbanizing faster than their ecosystems can absorb, and it hands planners a spatially explicit map of exactly where vegetation loss, wetland alteration, and construction are converging. In a city whose name may once have meant forest, the satellites now record how much of that forest, and the water threaded through it, remains to be saved.
Subject of Research: Spatiotemporal assessment of wetland, vegetation, and built-up land dynamics under urbanization using multi-temporal Landsat spectral indices in Ara city, India
Article Title: Assessment of wetland and vegetation dynamics in the context of urbanization and seasonal variation using surface indices in Ara city, India
Article References: Rahaman, L., & Sadaf (2026). Assessment of wetland and vegetation dynamics in the context of urbanization and seasonal variation using surface indices in Ara city, India. Discover Geoscience, 4(1), Article 380. https://doi.org/10.1007/s44288-026-00757-2
Image Credits: AI Generated
DOI: 10.1007/s44288-026-00757-2
Keywords: urbanization, wetlands, remote sensing, Landsat, NDVI, MNDWI, spectral indices, vegetation cover, Ara city, Bihar, migratory birds, sustainable urban planning
Cite Scienmag News
Margaret Porter. (October 2, 2026). Thirty Years of Satellite Eyes Reveal an Indian City Swallowing Its Wetlands. Scienmag. https://scienmag.com/thirty-years-of-satellite-eyes-reveal-an-indian-city-swallowing-its-wetlands/
Margaret Porter. "Thirty Years of Satellite Eyes Reveal an Indian City Swallowing Its Wetlands." Scienmag, 2 October 2026, https://scienmag.com/thirty-years-of-satellite-eyes-reveal-an-indian-city-swallowing-its-wetlands/. Accessed 2 October 2026.
Margaret Porter. "Thirty Years of Satellite Eyes Reveal an Indian City Swallowing Its Wetlands." Scienmag. October 2, 2026. https://scienmag.com/thirty-years-of-satellite-eyes-reveal-an-indian-city-swallowing-its-wetlands/


