


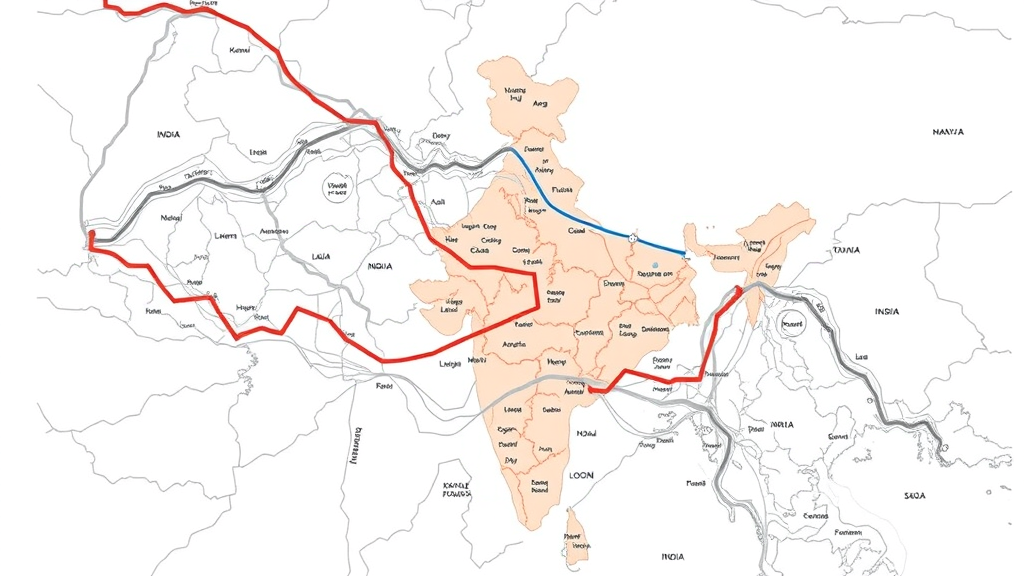
Deep in the Indian Himalayan state of Uttarakhand, one of the country’s most ambitious infrastructure projects is carving an all-weather corridor through some of the world’s most fragile terrain, and a new study warns that conventional impact assessments are fundamentally blind to what the highway is doing to the communities it touches. The Char Dham Expressway Project aims to upgrade roughly 890 kilometres of single-lane pilgrimage route into a two-lane, all-weather highway branching into four high-altitude valleys toward the sacred temples of Yamunotri, Gangotri, Kedarnath and Badrinath. Officially conceived for spiritual tourism, strategic defence and regional development, the project traverses an altitudinal range from 800 to more than 3,500 metres, crossing ecological zones that span mixed forest vegetation to high-altitude tundra. The terrain is characterised by unconsolidated rock, steep gradients and active seismicity, conditions highly prone to landslides and observed in numerous sections along National Highways 34 and 107. This inherent fragility, the research argues, is not merely a backdrop but a co-constitutive force that shapes the magnitude, direction and distribution of the project’s impacts.
The study, published in Environmental and Sustainability Indicators, introduces a framework that fuses machine learning with satellite-based environmental monitoring to construct a dynamic baseline of household vulnerability and capability along three distinct stretches of the highway. Its central insight is deceptively simple: because road projects of this scale are built in segmented phases for administrative and logistical convenience, pre-development, construction and post-development conditions exist simultaneously on different sections of the same corridor. Traditional assessment designs, which assume a sequential project lifecycle, collapse under this temporal parallelism, fragmenting impact information precisely where it is most needed. The author calls this methodological stagnation a pathway to development paralysis, a state in which planners cannot understand current habitat-level interactions and therefore cannot anticipate stakeholder grievances or design effective policy.
To break that paralysis, the research surveyed 462 households across three field clusters along the highway axis, each representing a different phase of development: a pre-development stretch, an active construction zone and a post-development segment. Using a multi-stage purposive sampling design grounded in standard Indian environmental impact assessment buffer guidelines, the study grouped villages sharing common valley habitats into development clusters and conducted a census-style digital survey using Open Data Kit. Forty-nine discrete indicators of household wellbeing were processed into a cumulative capability index, drawing on Anderson and Woodrow’s Capacities and Vulnerabilities framework and the Alkire-Foster multidimensional methodology, and spanning six themes: access to social welfare, development goods, economic stability, human capital, public health access, and ownership of land and immovable property.
The analytical heart of the study lies in its use of interpretable tabular machine learning models, TabNet and TabPFN, to identify which indicators truly drive differences in household capability. TabNet employs sequential attention masks, including Sparsemax and Entmax, to isolate significant features from high-dimensional socio-economic data, while TabPFN, a pretrained tabular foundation model, handles small datasets with remarkable efficiency. When benchmarked against traditional classifiers, the results were striking. Random Forest managed only 52 per cent accuracy, XGBoost 49 per cent, and SVM 69 per cent, but TabPFN achieved 86 per cent accuracy and an identical macro F1 score, with a macro ROC-AUC of 0.986. Crucially, its misclassifications were almost entirely ordinal, leaking only between adjacent capability classes, which strengthens confidence that the model captures a genuine underlying gradient of household resilience rather than noise.
The capability scores themselves told a nuanced story. Among the 462 households surveyed, composite scores ranged from 13 to 39 out of 49 possible indicators, following a roughly normal distribution in which more than 71 per cent of households possessed at least half of the measured capabilities. Cross-thematic analysis revealed that social assets and economic stability were moderately correlated, suggesting that economic status manifests largely through asset ownership, while education access stood apart with no significant linear relationship to other themes. At the indicator level, access to television media, reliable electricity supply for more than 12 hours a day, emergency healthcare access and female job-preference education emerged as the most powerful discriminants of relative capability across the region, pointing to the central importance of information access, energy reliability and gendered educational attainment.
Perhaps the most compelling finding is that the drivers of household capability change systematically across the project lifecycle, a pattern pooled analyses would completely obscure. In the pre-development cluster, capability differences were concentrated in pre-existing endowments, with television ownership and emergency healthcare access jointly accounting for roughly half of the cumulative top-ten feature weights. During active construction, the importance distribution flattened dramatically, with ten variables clustered within a narrow range and out-of-pocket health expenditure emerging as the leading predictor, alongside housing-quality indicators such as roof material and settlement-stability measures including residency permanency and potable water access. This diffuse structure is consistent with communities absorbing construction-phase disruptions through many small, exposure-linked stresses rather than a few dominant shocks. In the post-development cluster, house ownership, absent from both earlier phases, became the single largest predictor, a pattern the author links to redevelopment of immovable assets and capacity addition in hospitality infrastructure such as homestays along the completed highway.
Only two indicators persisted across all three phases: out-of-pocket health expenditure and female education for employment. Their consistent salience suggests that health-cost burdens and gendered educational attainment function as structural constraints on capability that are largely orthogonal to the project cycle itself. The study reinforces this with perturbation testing: when Gaussian noise of 5 per cent variance was applied to the self-reported household data, 17 per cent of households reclassified, indicating that a large share of the population sits precariously on the boundary of its current capability class. At 10 per cent variance, nearly a quarter of households shifted, and the direction of movement reversed, with more households moving up than down, a threshold effect suggesting that minor shocks degrade household standing while larger perturbations may trigger compensatory mechanisms within communities.
Parallel to the machine learning analysis, the study tracked environmental change using Sentinel-2 imagery at 10-metre resolution across four temporal benchmarks from 2016 to 2025, processed through Google Earth Engine. Land-use and land-cover analysis revealed a persistent, cluster-independent trade-off between forest and agriculture, with forest cover inversely correlated with agricultural extent in every spatial subset, reaching a global correlation of negative 0.90. Built-up area sustained positive growth across the full period, expanding by 2.03 per cent, with the sharpest increase of 1.72 percentage points occurring between 2019 and 2022, potentially reflecting capacity addition in tourism and hospitality assets during the pandemic lockdown phases. In the construction cluster, built-up expansion correlated strongly with agricultural contraction and water-body decline, signs that excavation and muck-dumping works are disturbing spring paths that sustain agriculture-based livelihoods in this landslide-prone landscape.
The convergence of independently derived social and spatial evidence is what gives the framework its diagnostic power. In the construction cluster, where machine learning flagged flat capability distributions dominated by exposure-linked indicators such as private health affordability and potable water access, satellite data simultaneously recorded the strongest statistical associations between infrastructure growth and environmental degradation. In the post-development cluster, where house ownership dominated capability predictions, the spatial analysis documented transitions in which agricultural land passed through an intermediate degraded, fallow stage before conversion to built-up use, rather than being directly substituted. High-capability households in the post-development zone clustered neatly around the highway axis, while high-capability zones in the earlier phases appeared as inherited strengths rather than project-derived gains, a distinction with direct implications for how planners interpret baseline data.
The study’s implications reach well beyond Uttarakhand. It demonstrates that household resilience is not time-invariant, that capability drivers migrate from asset endowments through exposure-linked drains during construction before consolidating into spatialised real-estate assets, and that community systems exhibit threshold effects under perturbation. For a sector in which development imperatives routinely outpace assessment mechanisms, and in which template-driven, context-agnostic impact reports have been repeatedly criticised for externalising local vulnerabilities, the approach offers a way to back-propagate learnings from completed segments into stretches where construction has not yet begun. The author cautions that machine learning on small datasets carries overfitting risks, and that data-supported policy decisions still require stakeholder engagement and in-situ validation. Yet the framework’s promise is clear: a dynamic, socially embedded diagnostic capable of identifying deficit clusters and guiding micro-level interventions as the socio-ecological realities of affected communities evolve along one of the world’s most consequential mountain corridors.
Subject of Research: Socio-environmental impact assessment of the Char Dham expressway in Uttarakhand, India, using machine learning and satellite land-cover analysis.
Article Title: The baseline of fragility and capability: Hedging socio-environmental impacts of Char Dham expressway in Uttarakhand, India
Article References: Kumar, S. (2026). The baseline of fragility and capability: Hedging socio-environmental impacts of Char Dham expressway in Uttarakhand, India. Environmental and Sustainability Indicators, 32, Article 101510. https://doi.org/10.1016/j.indic.2026.101510
Image Credits: AI Generated
DOI: 10.1016/j.indic.2026.101510
Keywords: Char Dham Expressway, Uttarakhand, impact assessment, machine learning, TabPFN, capability index, land use change, Himalayan fragility, household resilience, Sentinel-2, sustainability indicators, temporal parallelism
Cite Scienmag News
Teresa Odom. (September 23, 2026). Machine Learning Maps the Hidden Social Toll of India’s Char Dham Himalayan Expressway. Scienmag. https://scienmag.com/machine-learning-maps-the-hidden-social-toll-of-indias-char-dham-himalayan-expressway/
Teresa Odom. "Machine Learning Maps the Hidden Social Toll of India’s Char Dham Himalayan Expressway." Scienmag, 23 September 2026, https://scienmag.com/machine-learning-maps-the-hidden-social-toll-of-indias-char-dham-himalayan-expressway/. Accessed 23 September 2026.
Teresa Odom. "Machine Learning Maps the Hidden Social Toll of India’s Char Dham Himalayan Expressway." Scienmag. September 23, 2026. https://scienmag.com/machine-learning-maps-the-hidden-social-toll-of-indias-char-dham-himalayan-expressway/


